Radiation Monitoring Computer System (RMCSv2) Screen Shots
Apr 24, 2024
Click on any of the screen shots below to see a 1280x1024 version of the
screen (or 1024x1280 for the Portrait mode examples.)
Note that most browsers will automatically scale the image to fit in the browser window. To
view the image full screen, most browsers support use of the F11 key to toggle a full screen
display mode.
Use the browser's BACK button to return from the image back to this screen.
Also, please note that the data being used to generate these screens comes from a pseudo
random number generator, NOT real, live hardware.
Basic Screens and Features
We consider our versions of the screens we have most commonly seen in use at
customer sites using older radiation monitoring systems to make up a "basic" set of
functionality that just about all customers use.
For an overview of EVI's RMCS, and more details about basic features, please
read this article.
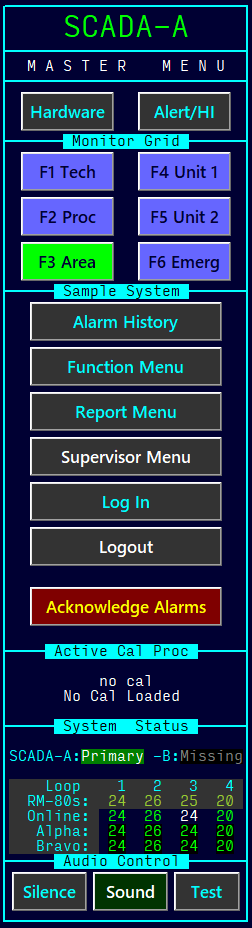
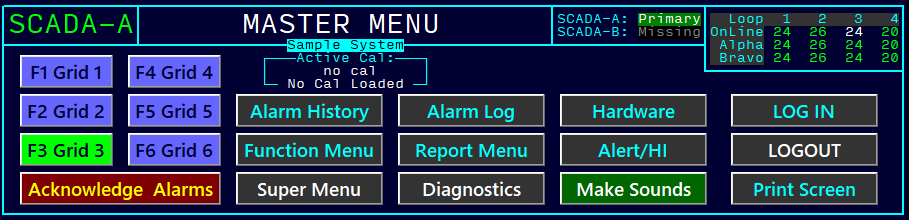
RMCS Display includes a fully customizable Master Menu that is
visible from all screens (except one.) The menu area is used to provide buttons for the most common
functions and to display some important status overview information.
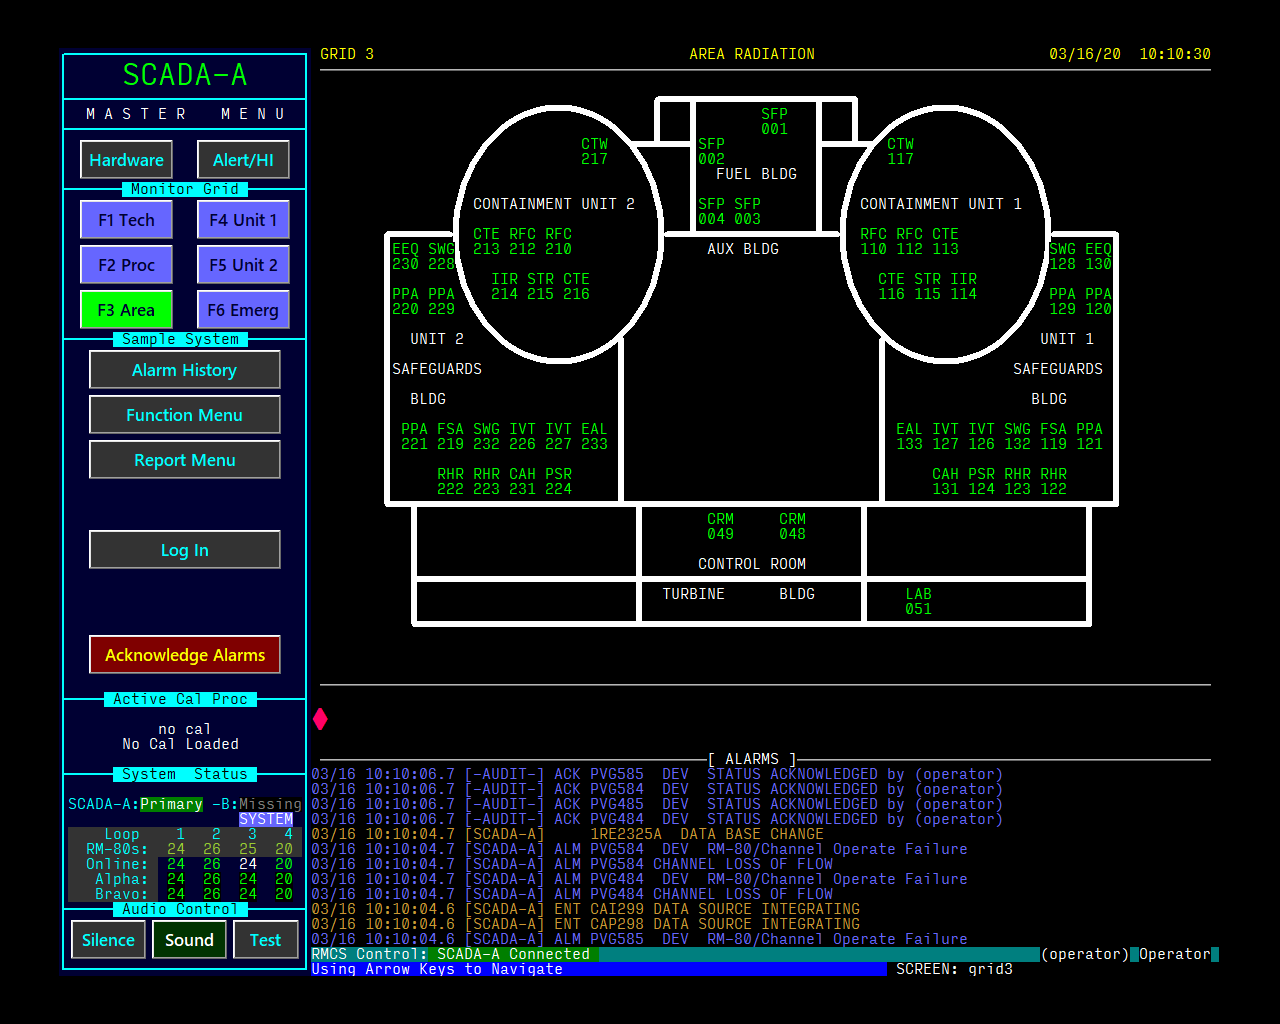
RMCS Display supports up to six GRID screens. This example shows a grid with graphically rendered
lines so that circles may be included. GRID screens may have an associated menu button that shows
the color of the WORST existing alarm on a grid.
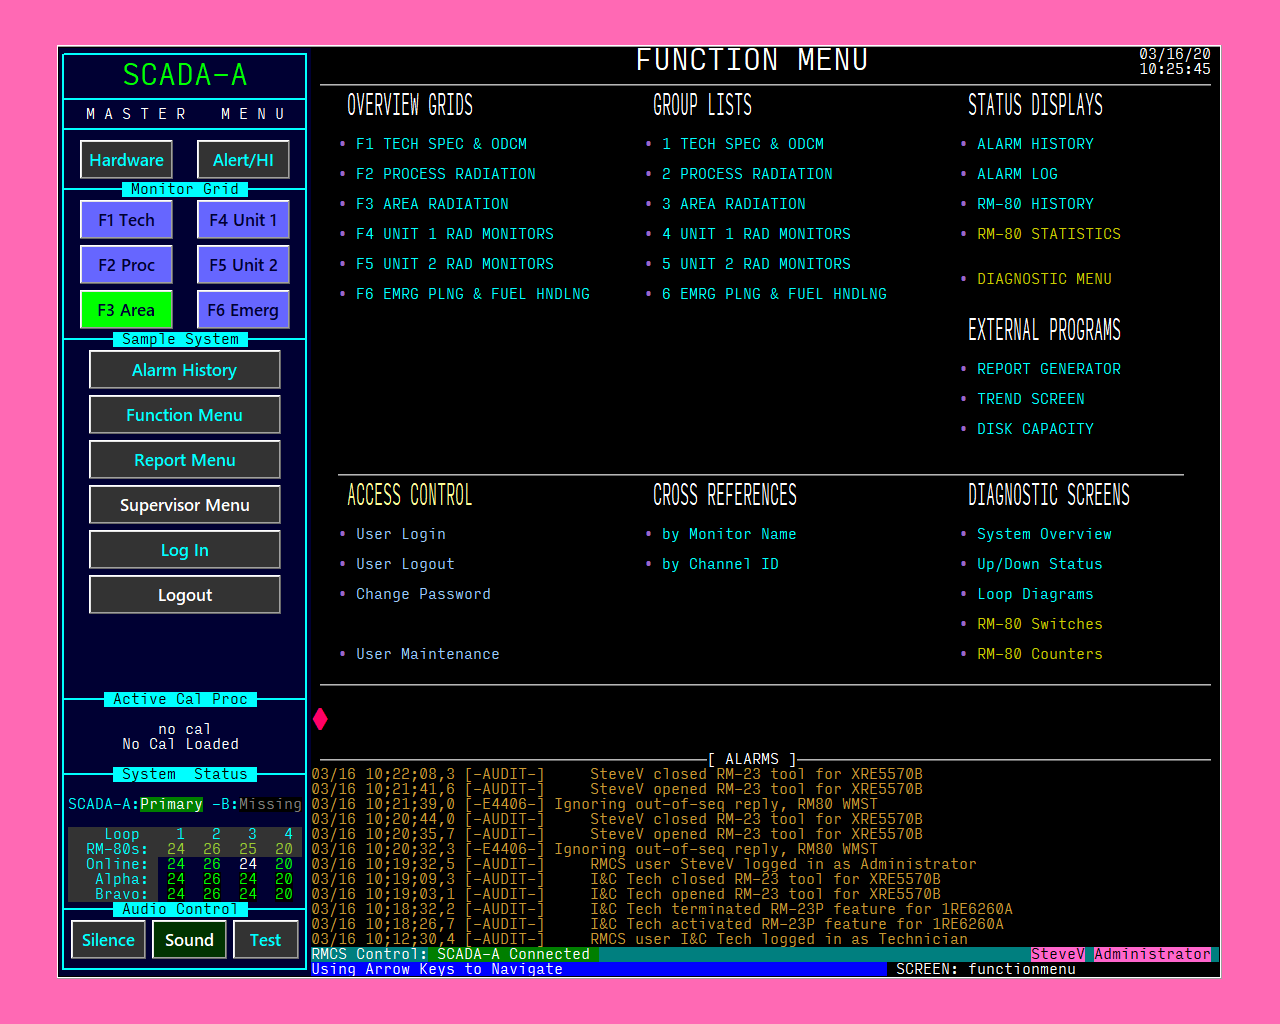
The Function Menu shows an example of a screen created to reference a number of other screens. These
menu screens are typically customized to show only what a customer wants/needs.
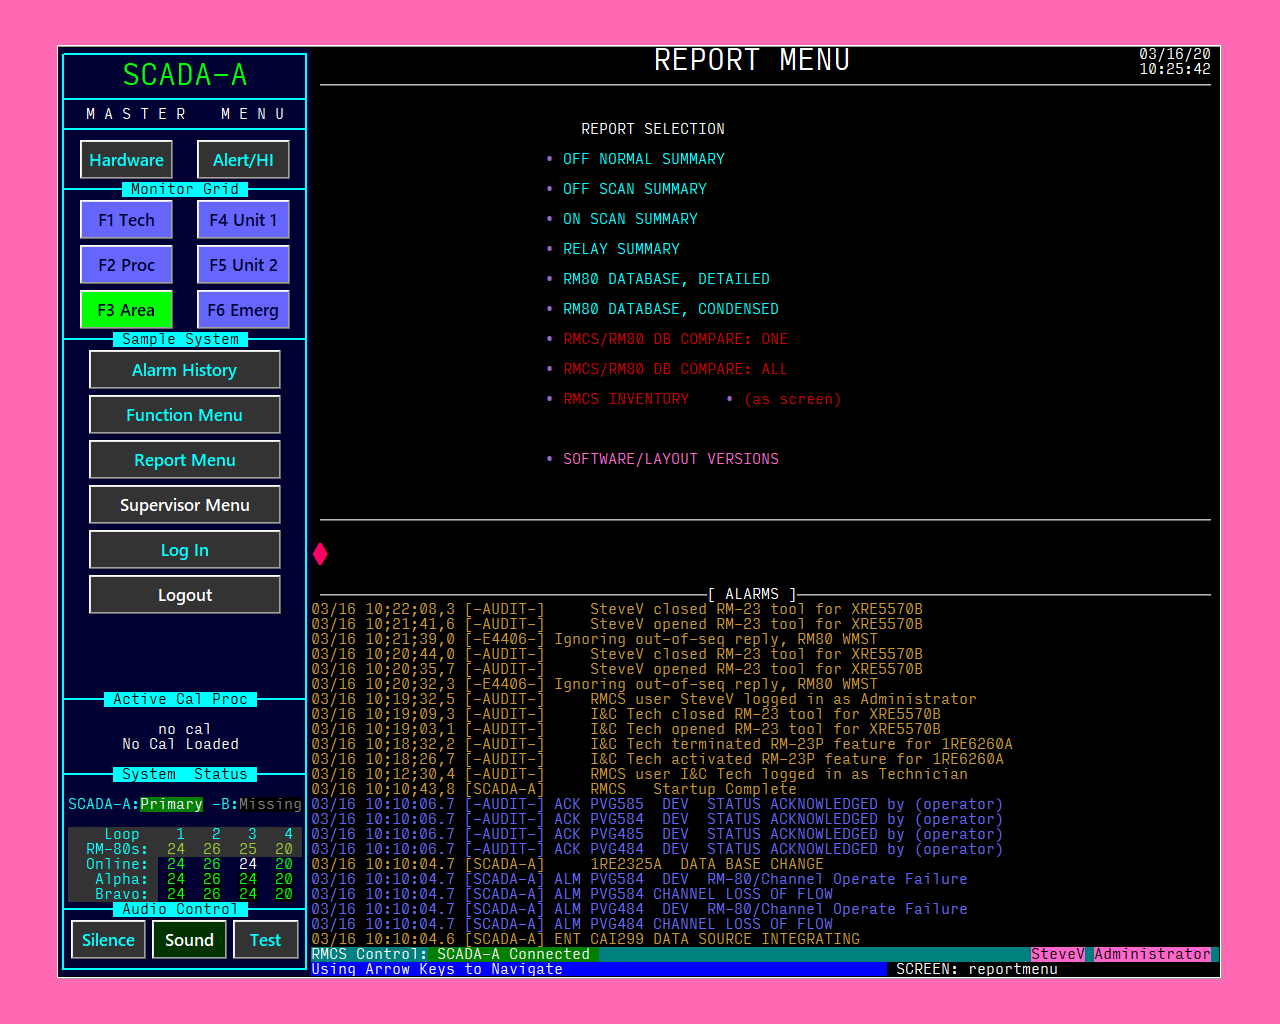
The Report Menu provides access to system-wide reports. Other reports are attached to specific screens,
for example the Grid Report or the Calibration Report.
A channel's value and alarm set points may be plotted over time as a trend graph. The graph's context
menu allows the time scale to be adjusted from 10 minutes up to 24 hours (in pre-selected steps.)
RMCS maintains history of ALL channel and item values, so the set point tracks will also show
recent changes.
This is the standard screen for viewing/changing channel item values. The purple dots beside
item values mark items that may be changed at the current access level (if the RM-80 will allow it.)
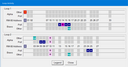
This is the standard screen for viewing/changing monitor item values. The purple dots beside
item values mark items that may be changed at the current access level (if the RM-80 will allow it.)
Here is an example of a flow diagram (for a WRGM). These diagrams may include dynamic fill colors. On
the WRGM diagram, the purge valves, pumps, and flow (beyond the pumps) are all controlled by the state of
monitor status flags from MI044.
The process and sample flows for an RM-80 are also saved in the data archive for use in historical
trend graphs like the example shown here.
Note that this example was captured after running the test system for only a few minutes, so the
graph shows the values suddenly jumping from zero to their actual values at the time the system was
started.
The Monitor Poll Status screen shows operators the current state of channel-level alarming and polling
as well as the state of monitor-level polling.
Supervisor access displays the additional info shown at the bottom of this example and Technician access
allows control of most of the settings displayed.
The Monitor/Channel Status screen shows the current state of all of the monitor and channel status
flags from an RM-80. Flags that are SET are shown using the color of the alarm condition they trigger.
When an editable (based on security access level) monitor or channel item is DOUBLE-CLICKED, the Monitor/Channel Item Editor will appear.
NOTE: The 'touch input' button will only appear on systems that report touch input available.
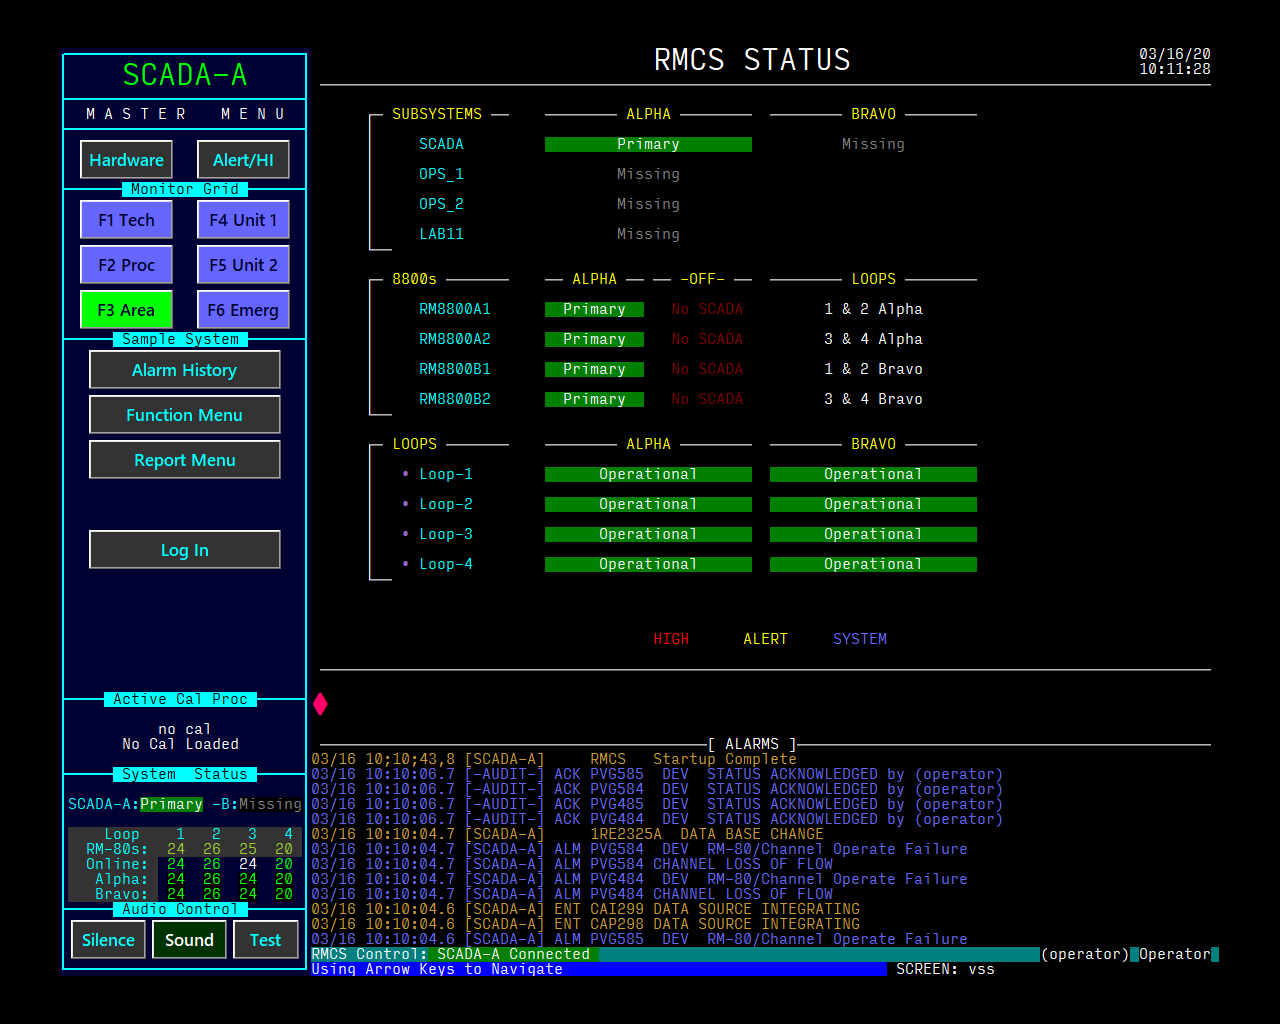
To see an overview of the current status of all computers in RMCS, look at the RMCS Status screen.
The subsystems show all of the RMCS Windows computers, 8800s show
the current loop concentrators, and Loops show the overall status of each side of
each loop. Clicking a loop will activate the Loop N Status screen.
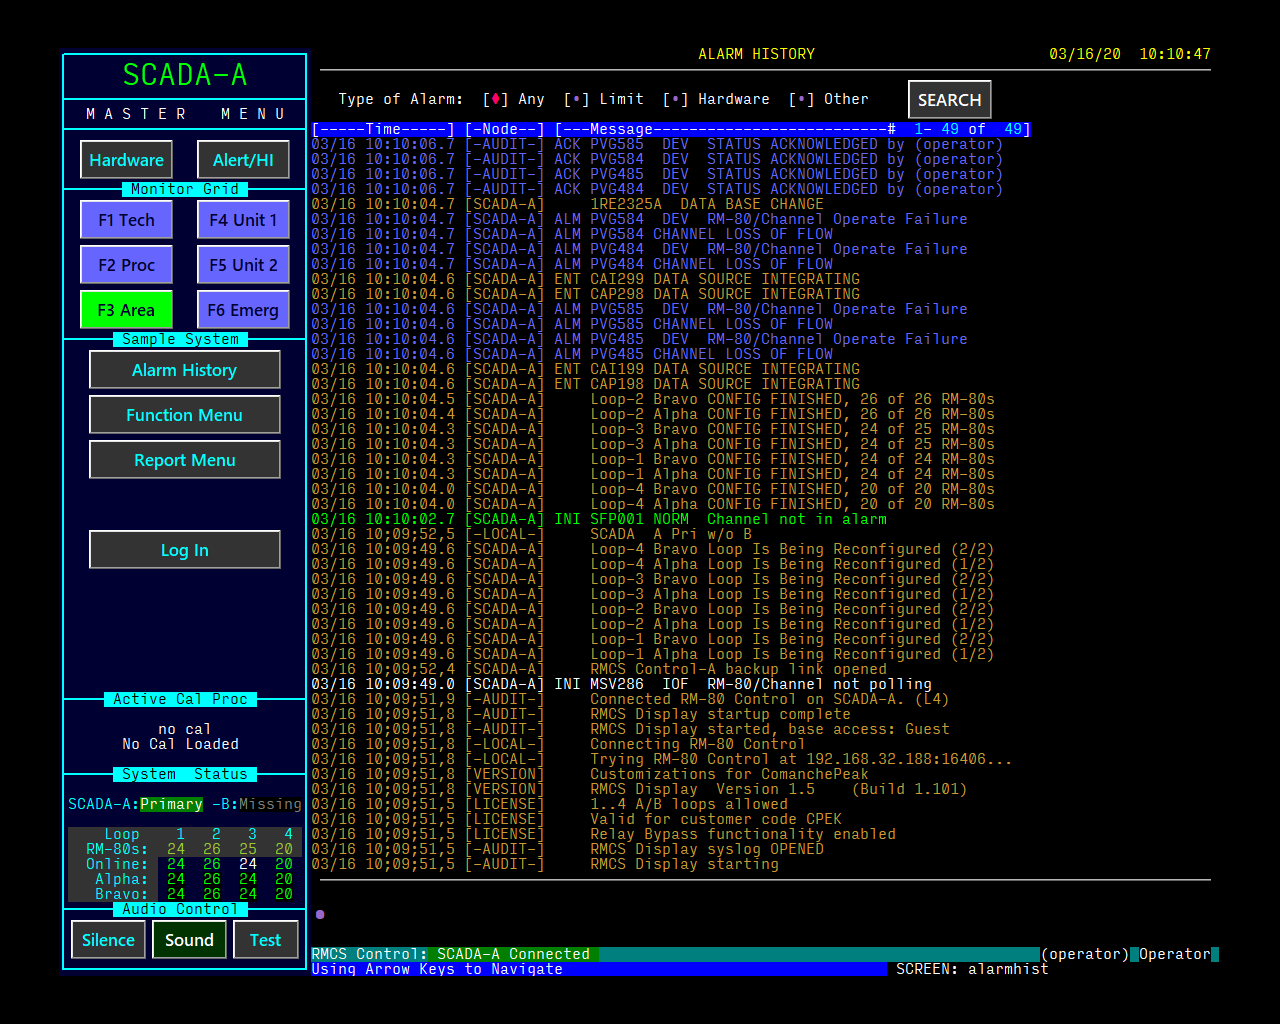
RMCS Display keeps the most recent 1,000 alarm log messages in a circular list. The Alarm History
screen allows the user to review the list.
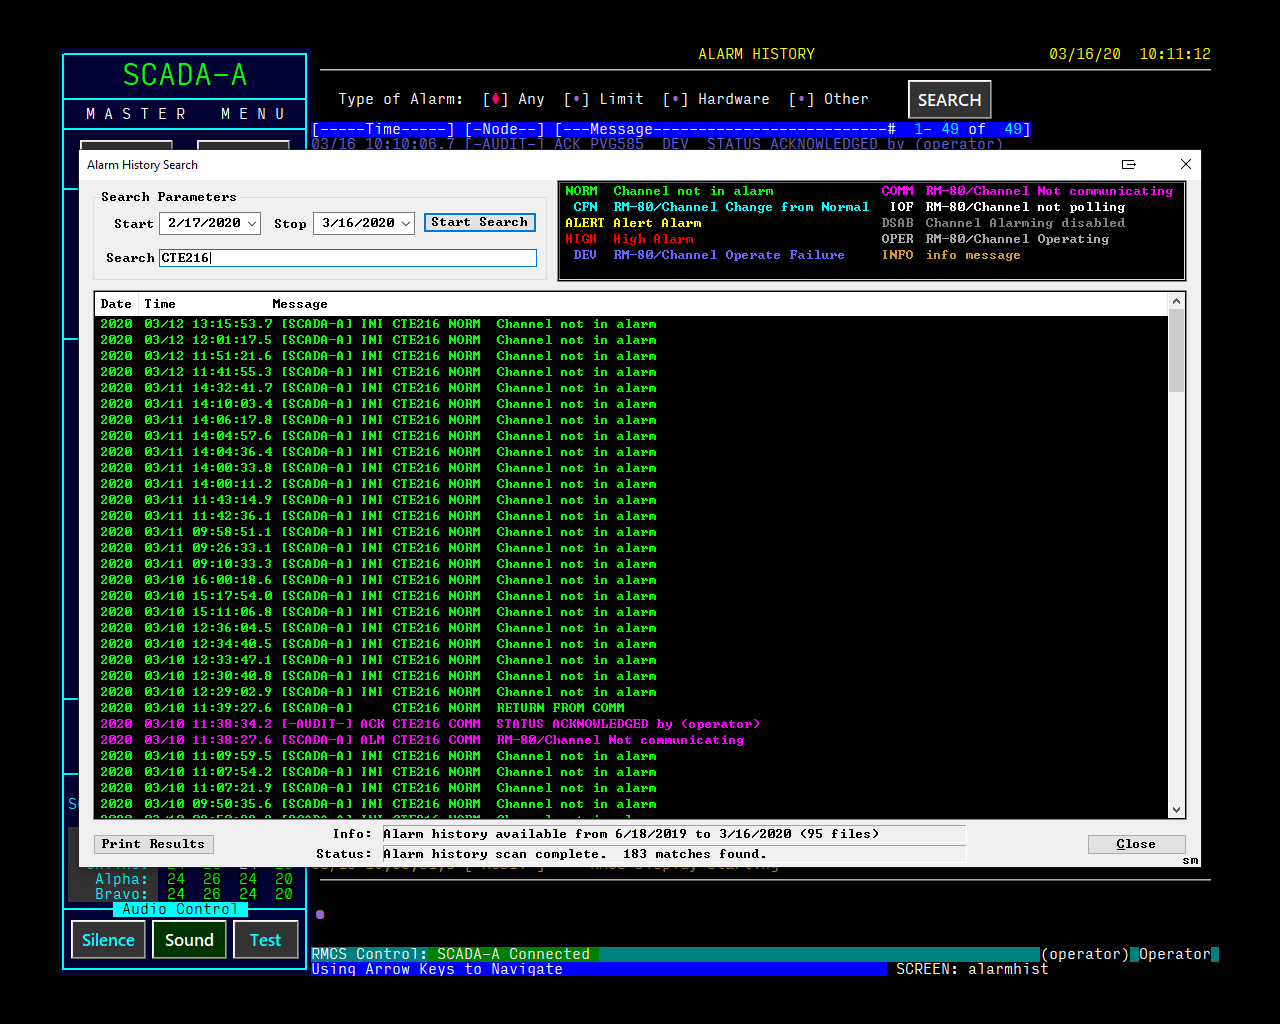
All of the Alarm History that has been saved on the local computer may also be searched, using the
Alarm History Search tool.
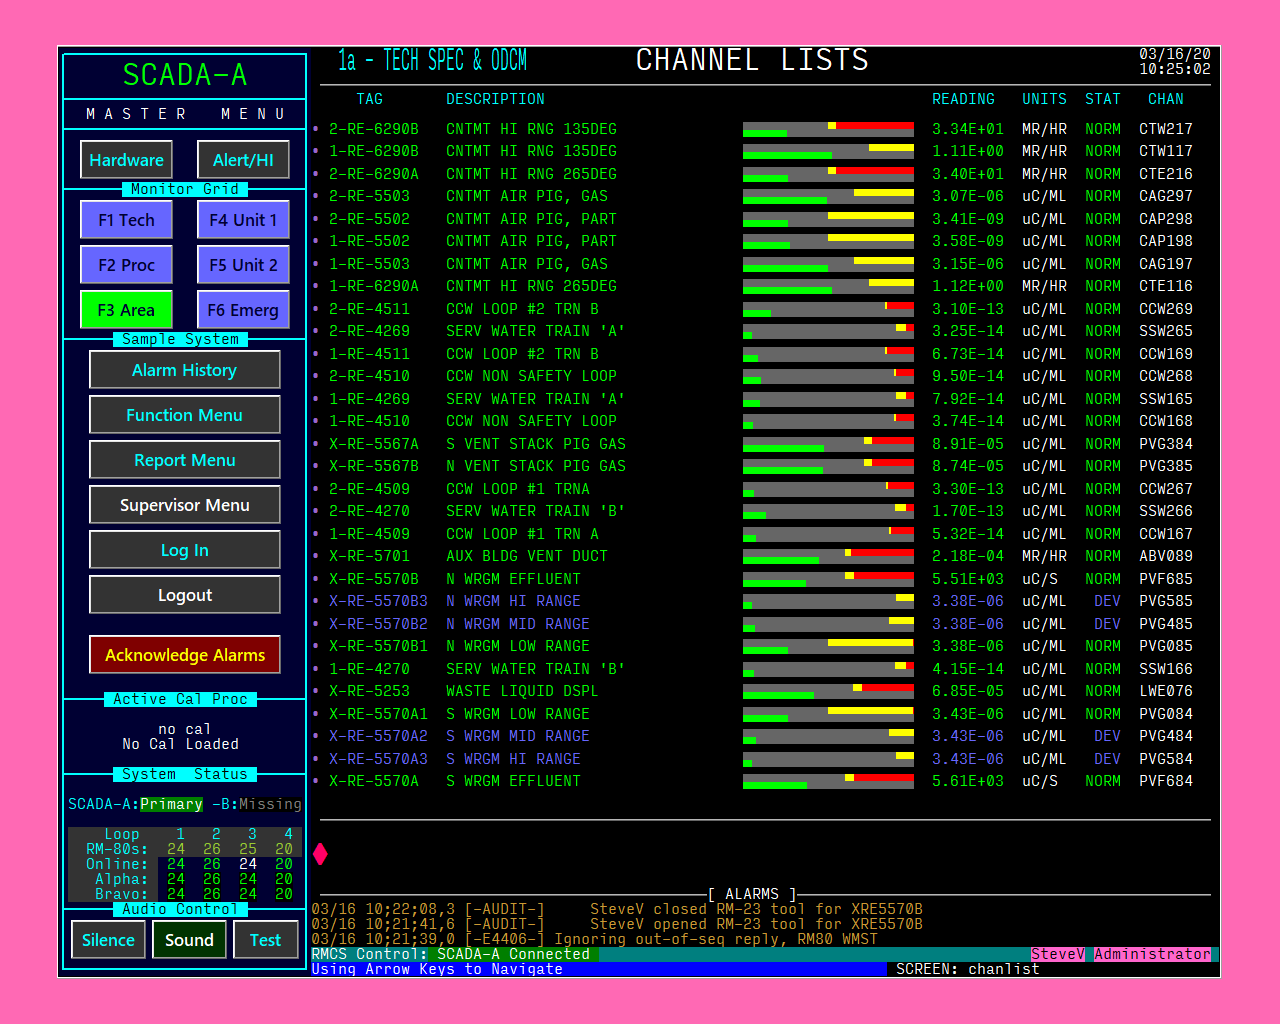
Example Channel List page. These screens show the current values and conditions of a number of user-defined
channels. A graph is also provided to show the relationship between the current channel reading and the
next/worst alarm limit.
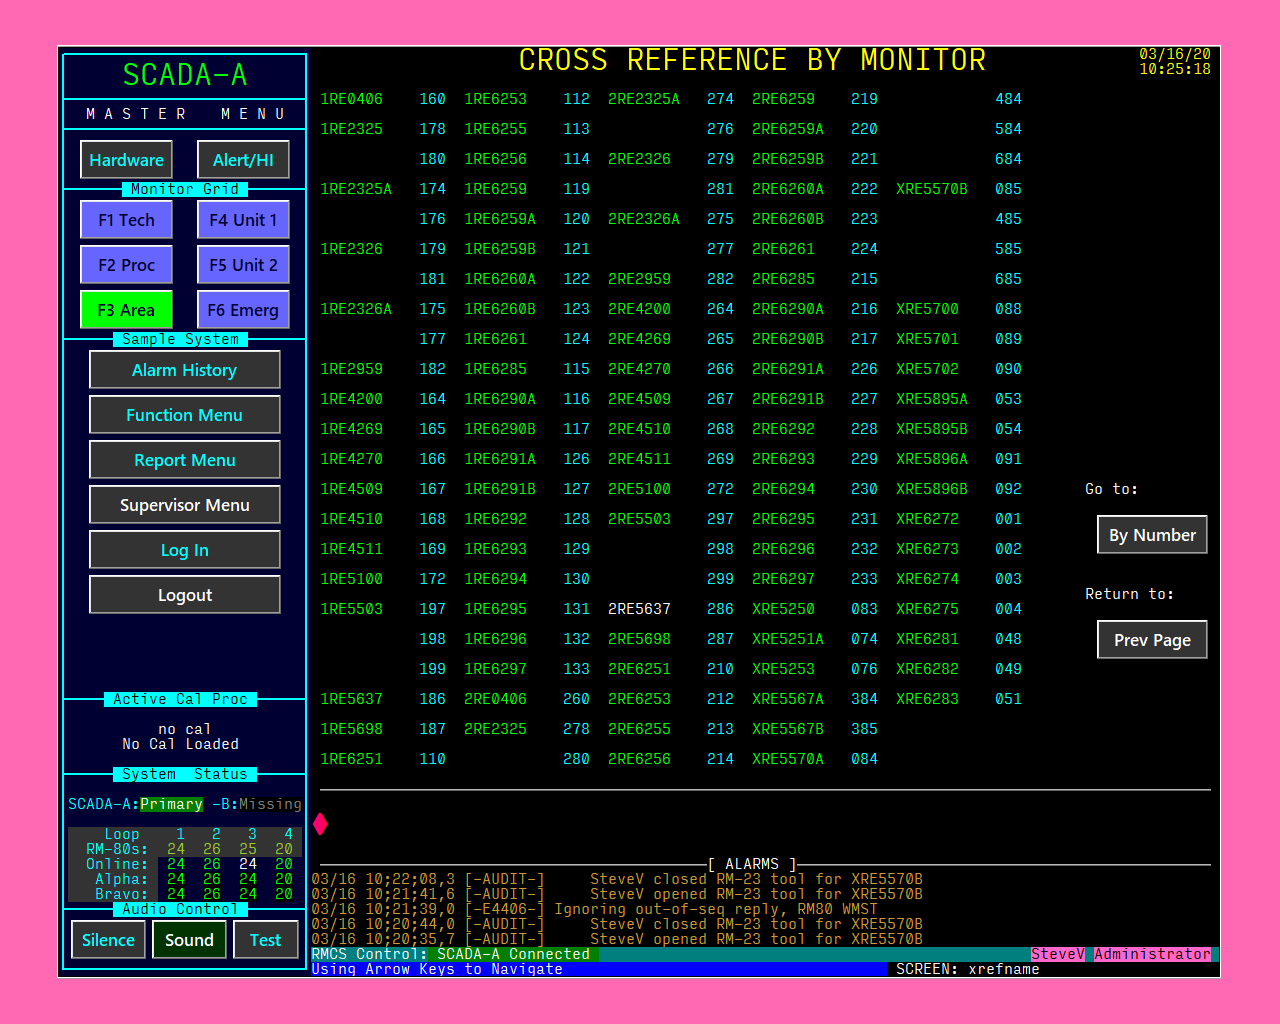
The Cross Reference screens list all of the channel points by either RM-80 Name or by Channel ID number.
Entries in the cross reference lists may be clicked to activate the default channel/RM-80 screen or
right-clicked to activate the channel's context menu.
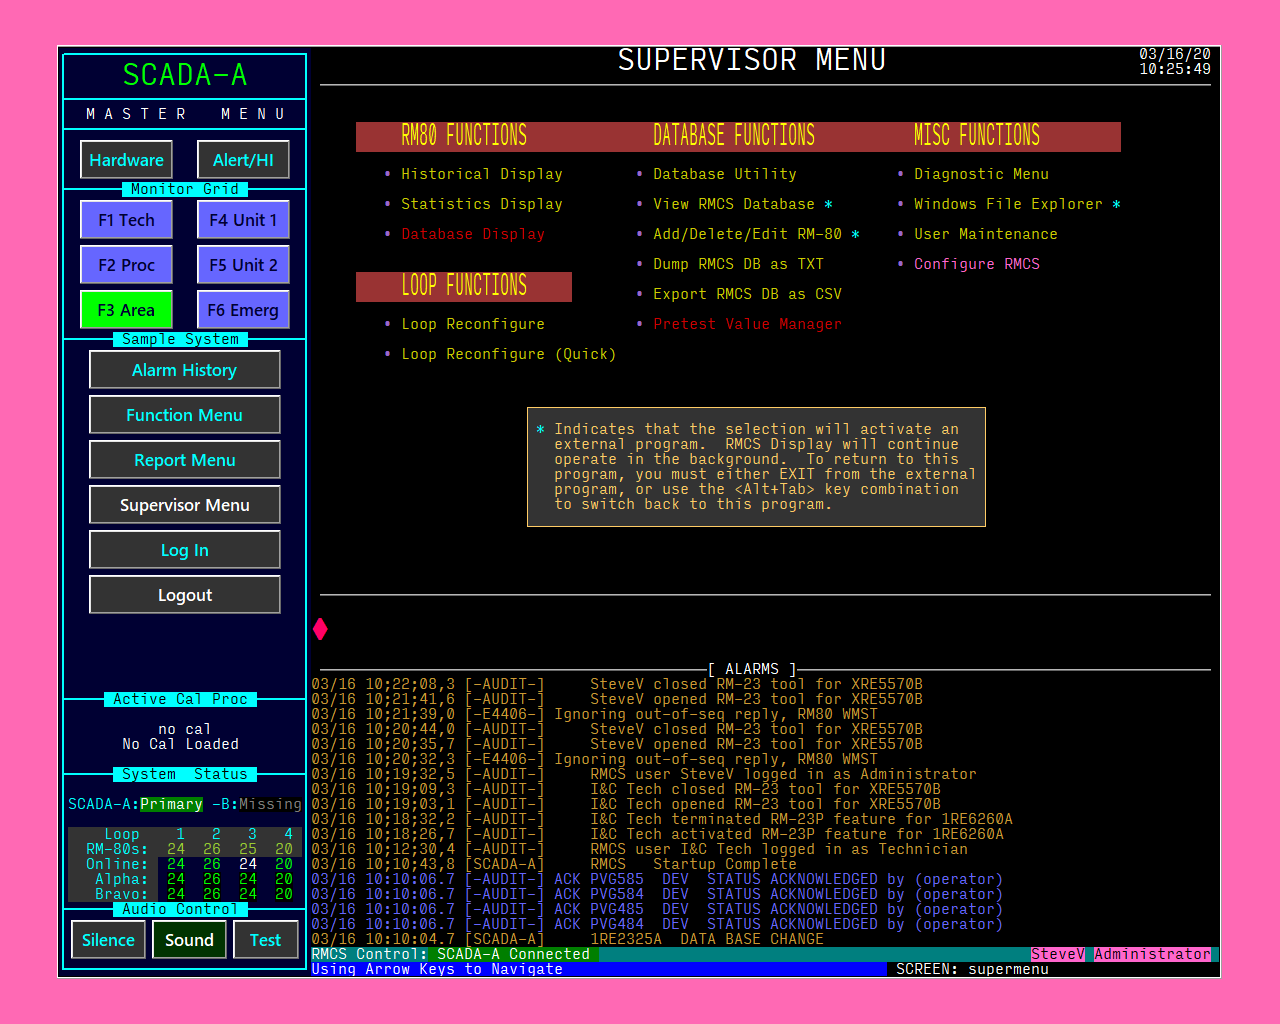
The Supervisor Menu is where functions that require Supervisor (or higher) access rights.
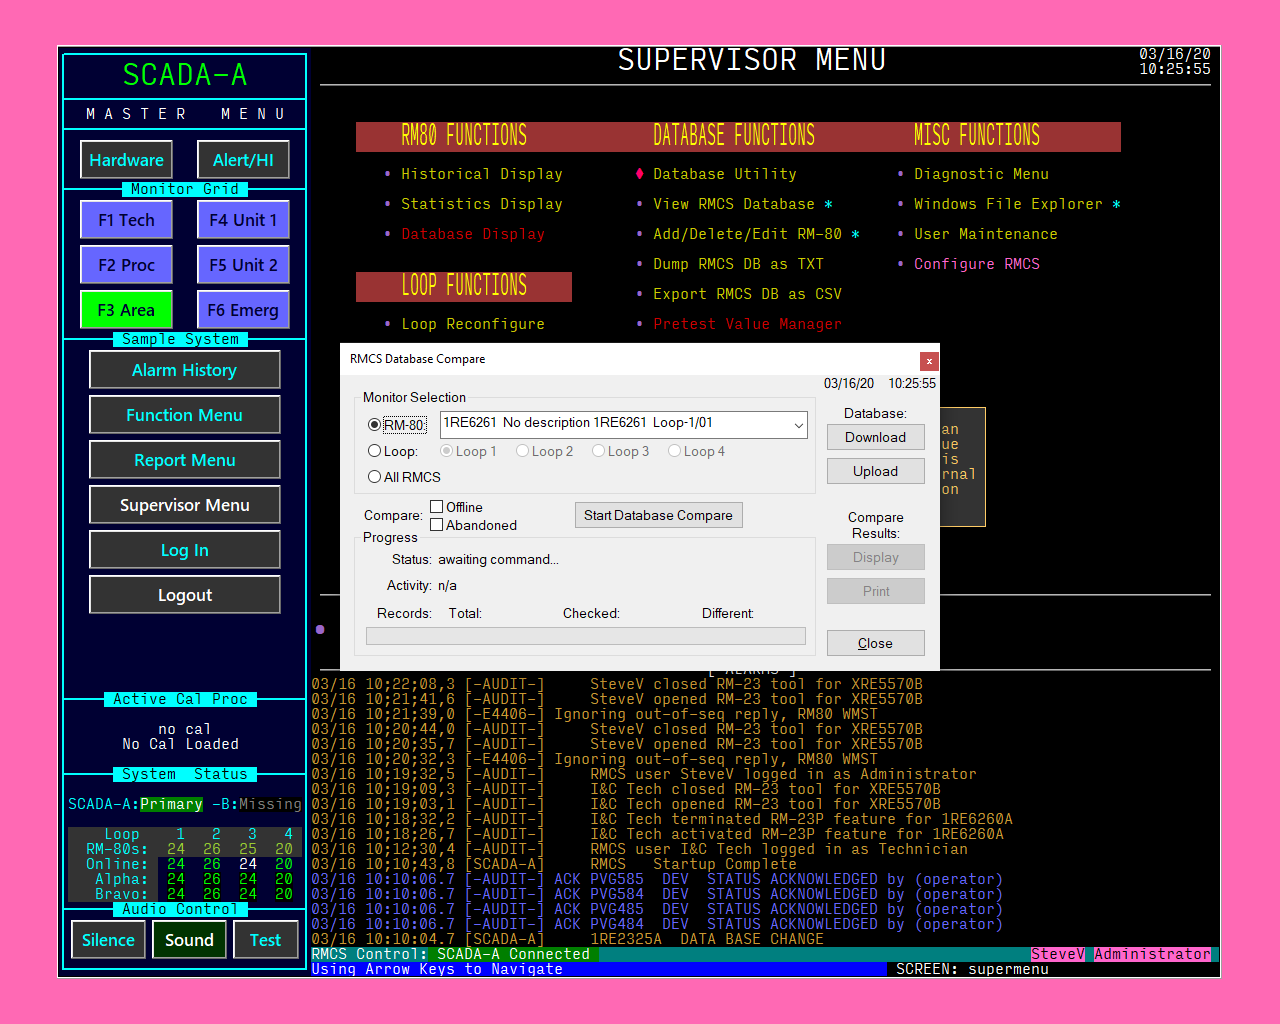
The primary function of the Database Utility is to compare the MASTER and CURRENT copies of the RM-80
monitor/channel item database that is maintained by RMCS.
The MASTER values are sent to an RM-80 as a download when the RM-80 reports Database Unknown in the
Monitor Status (MI044).
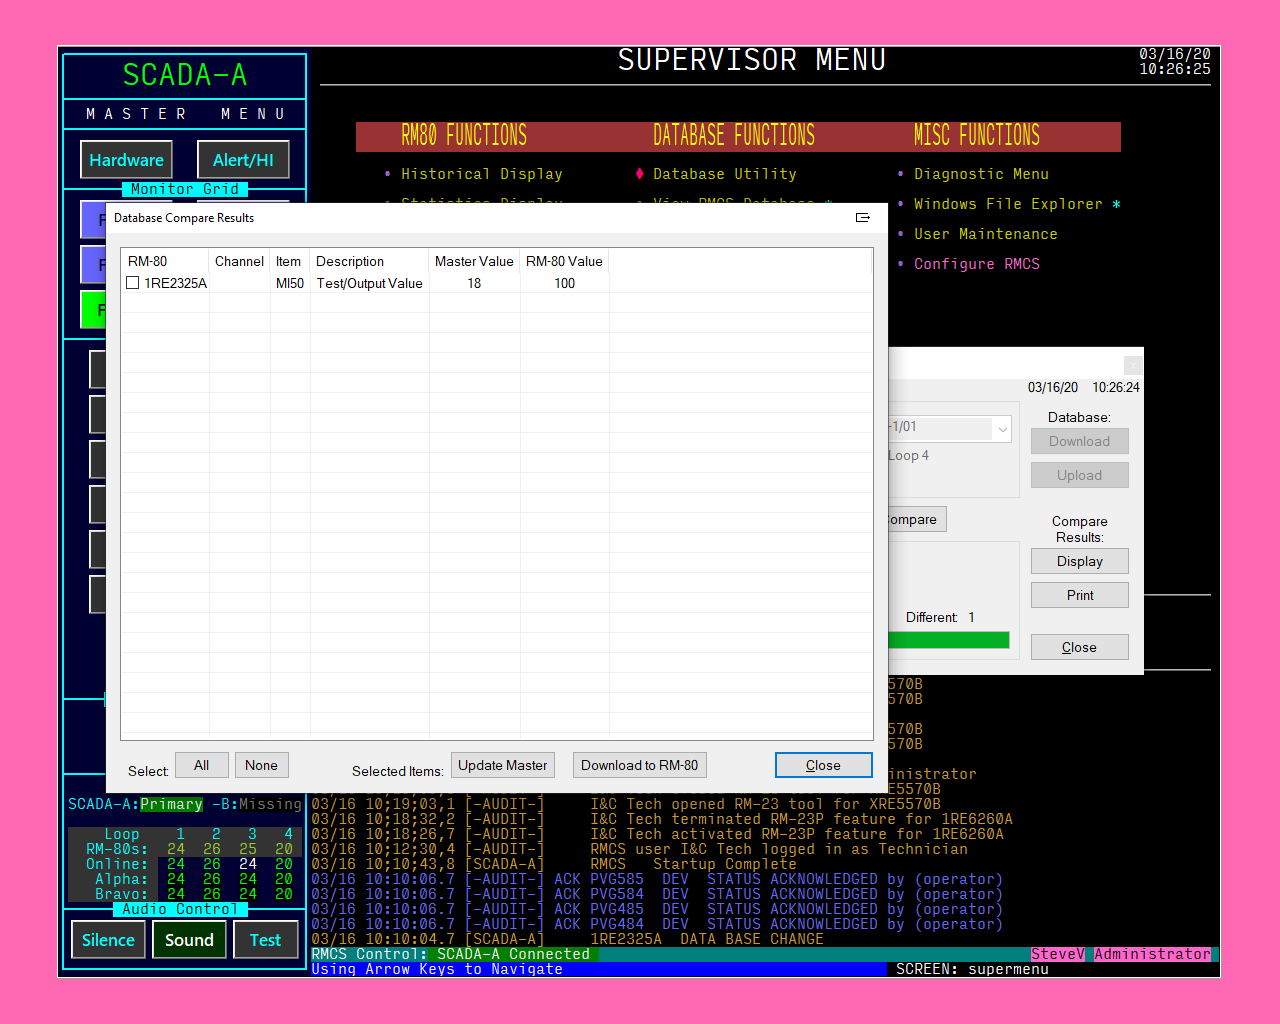
After a database compare has found one or more differences, the differences may be reviewed. Selected
items may be applied to either the RM-80 (assuming the RM-80 will allow the change) or to the MASTER copy.
Advanced/Diagnostic Screens and Features
These screens represent more advanced features of both the RM-80 and RMCS Display. Most of
these screens and features are geared toward system diagnostics.
The Loop Activity panel shows loop scanning activity in real time.
The Channel History screen shows channel value history that was
averaged and maintained by the RM-80 for the selected channel.
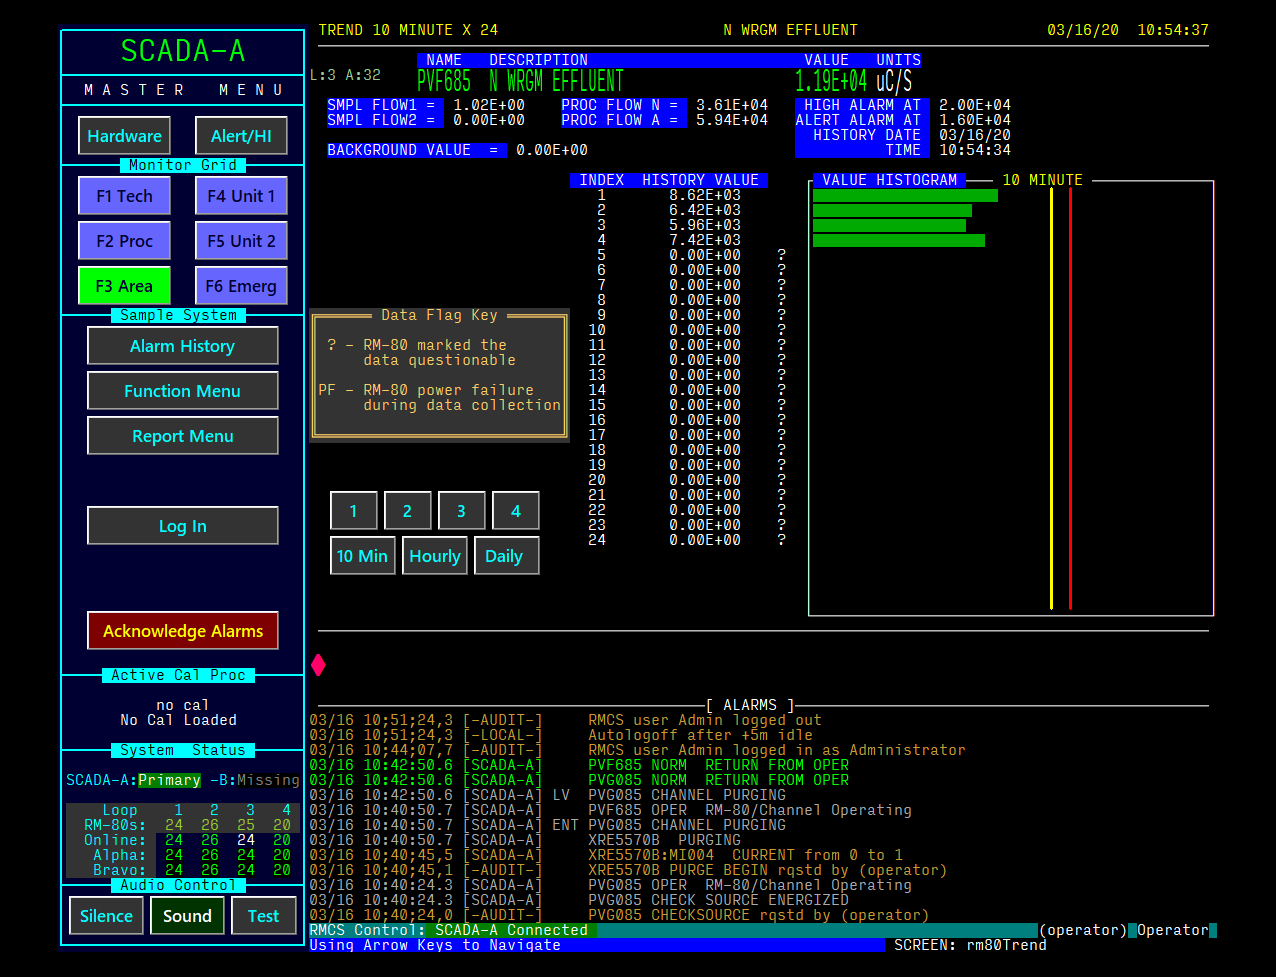
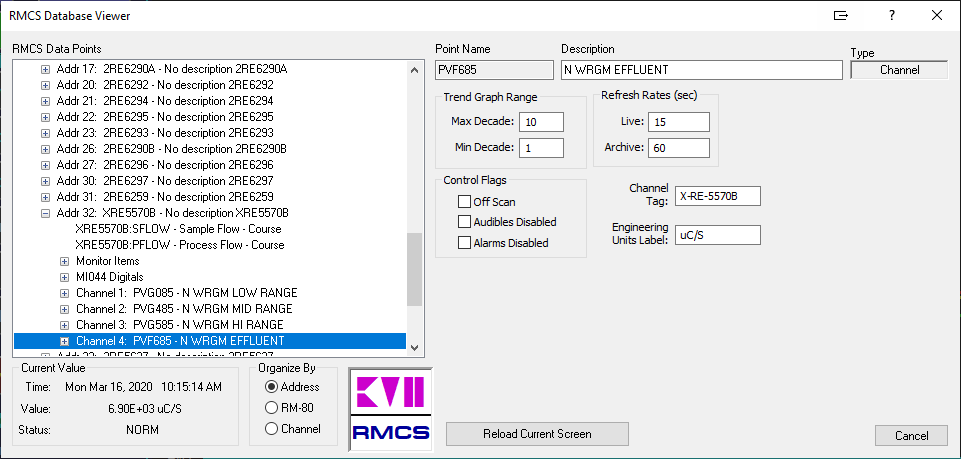
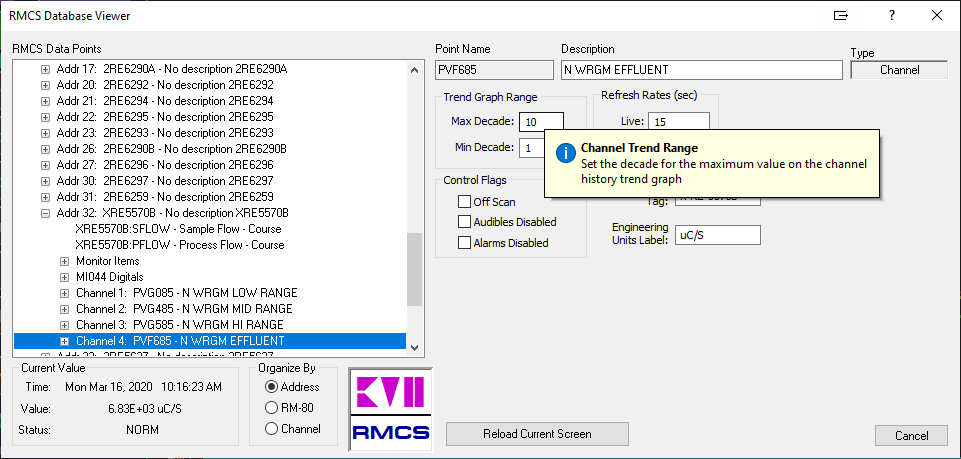
Here is an example of the RMCS Database viewer/editor (function
depends on security access). The panel to the right changes to provide setting values appropriate for the
item selected from the tree list on the left. The list may be sorted by Address, RM-80 or Channel name.
The database viewer supports item help tips.
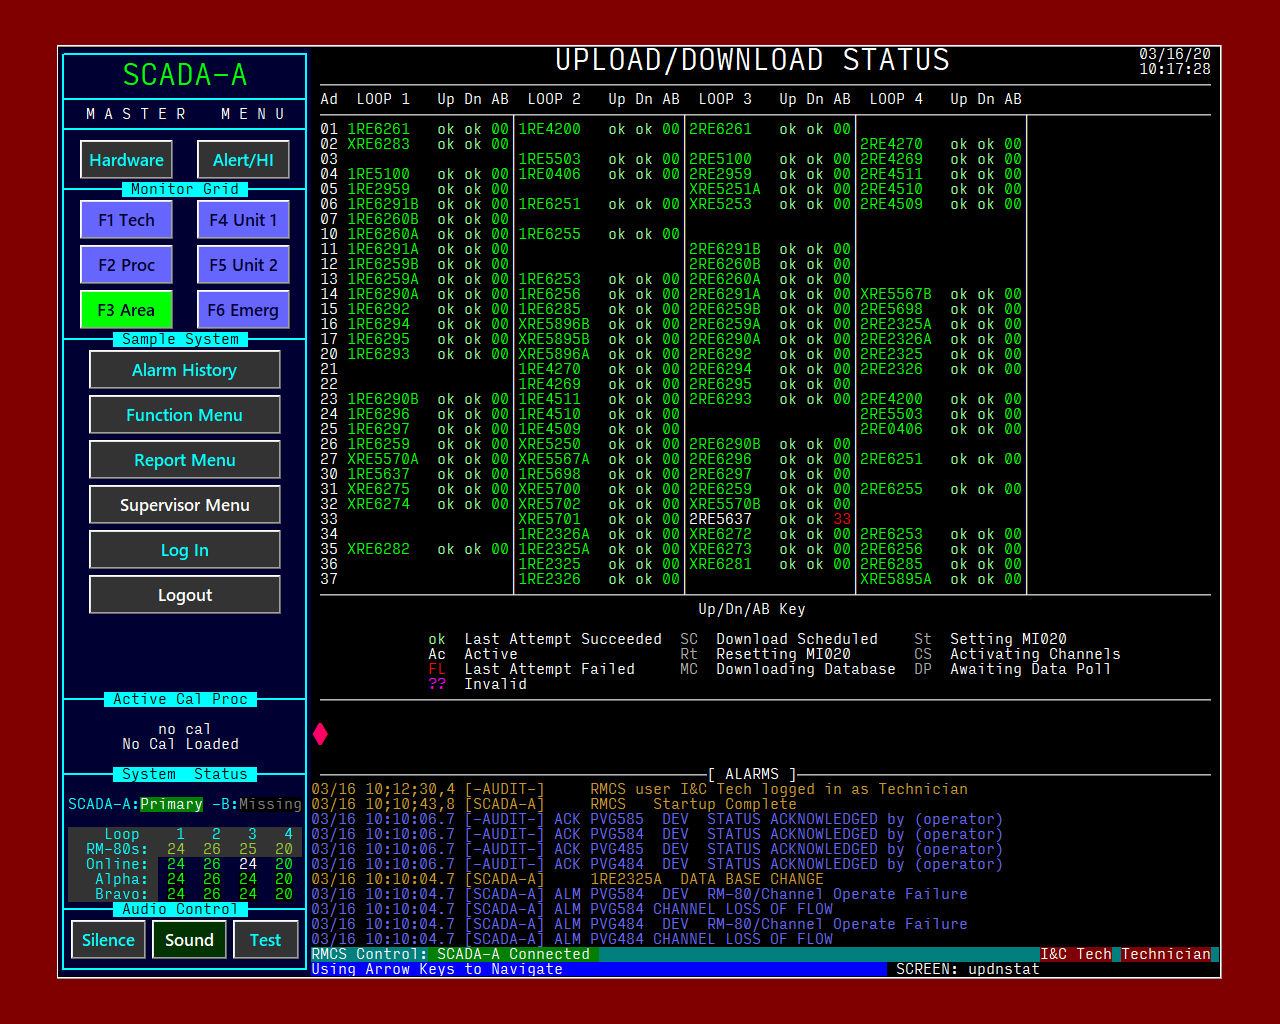
The Upload/Download Status screen shows the upload and download activity for all RM-80s on all loops.
Each RM-80s' status for each loop side is also displayed here.
This screen is often used to monitor loop configuration commands and activity.
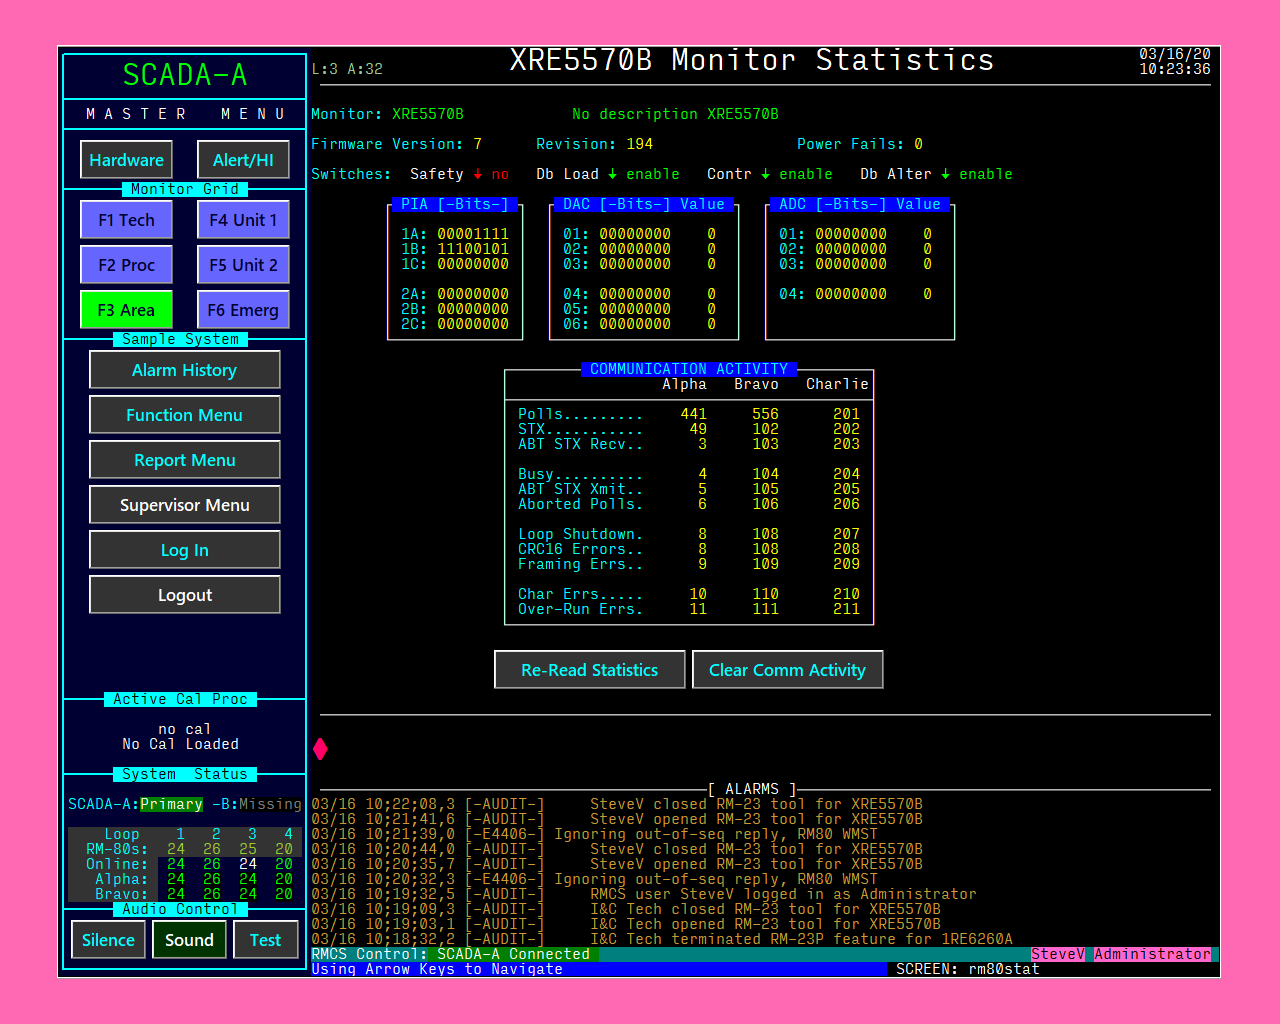
The Monitor Statistics screen shows the data returned by an RM-80 in response to a monitor statistics
request. The Switches row decodes the lower four bits of PIA1A. The PIA values are shown
in binary because the fields only have meaning as individual bits. The DAC/ADC values are shown
as binary and byte. All of the Communication Activity values are unsigned 16 bit integers.
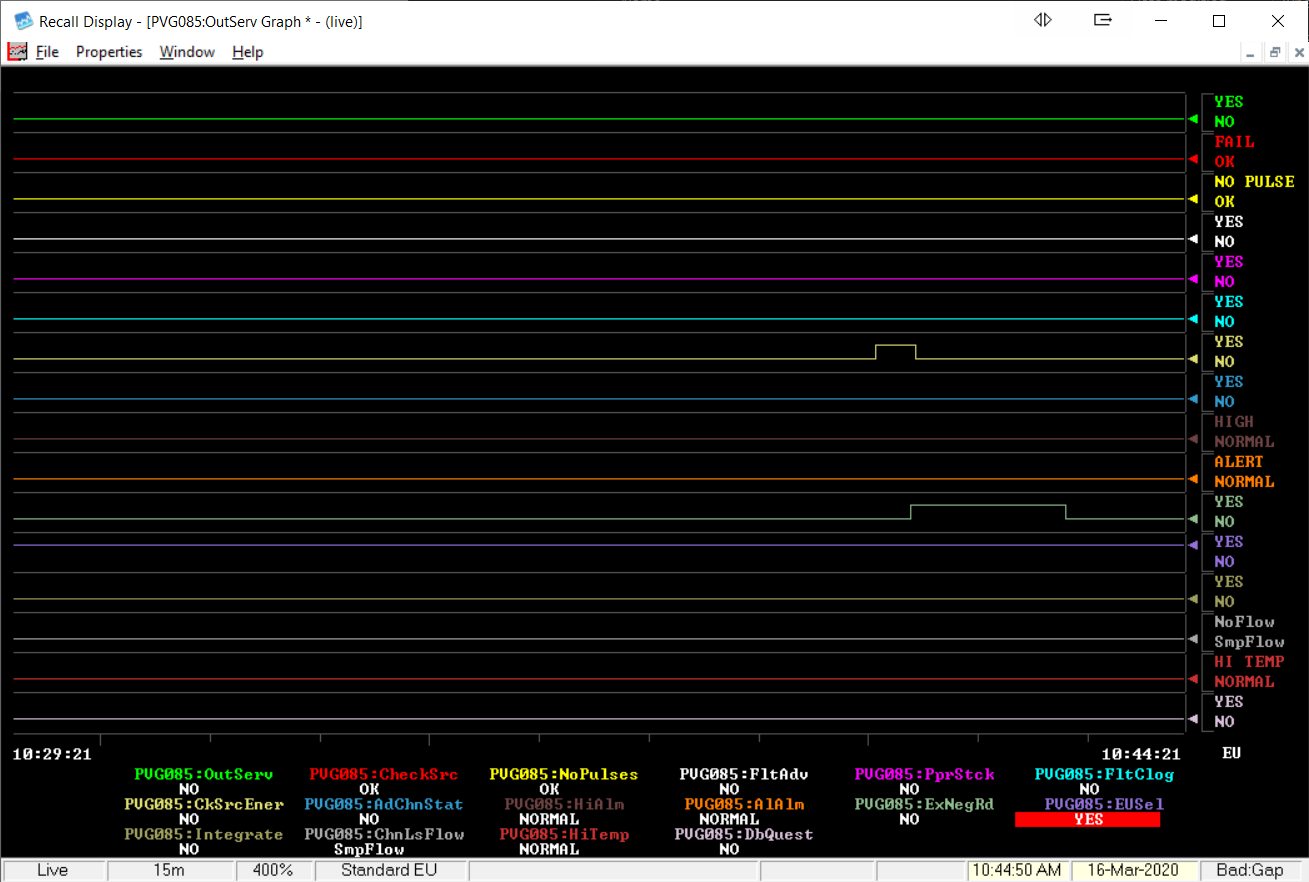
RMCS includes an external trending program that has much
more power for trending values. This example shows all of a channel's status flags being trended over
time. This graph may be created automatically from the channel's context menu.
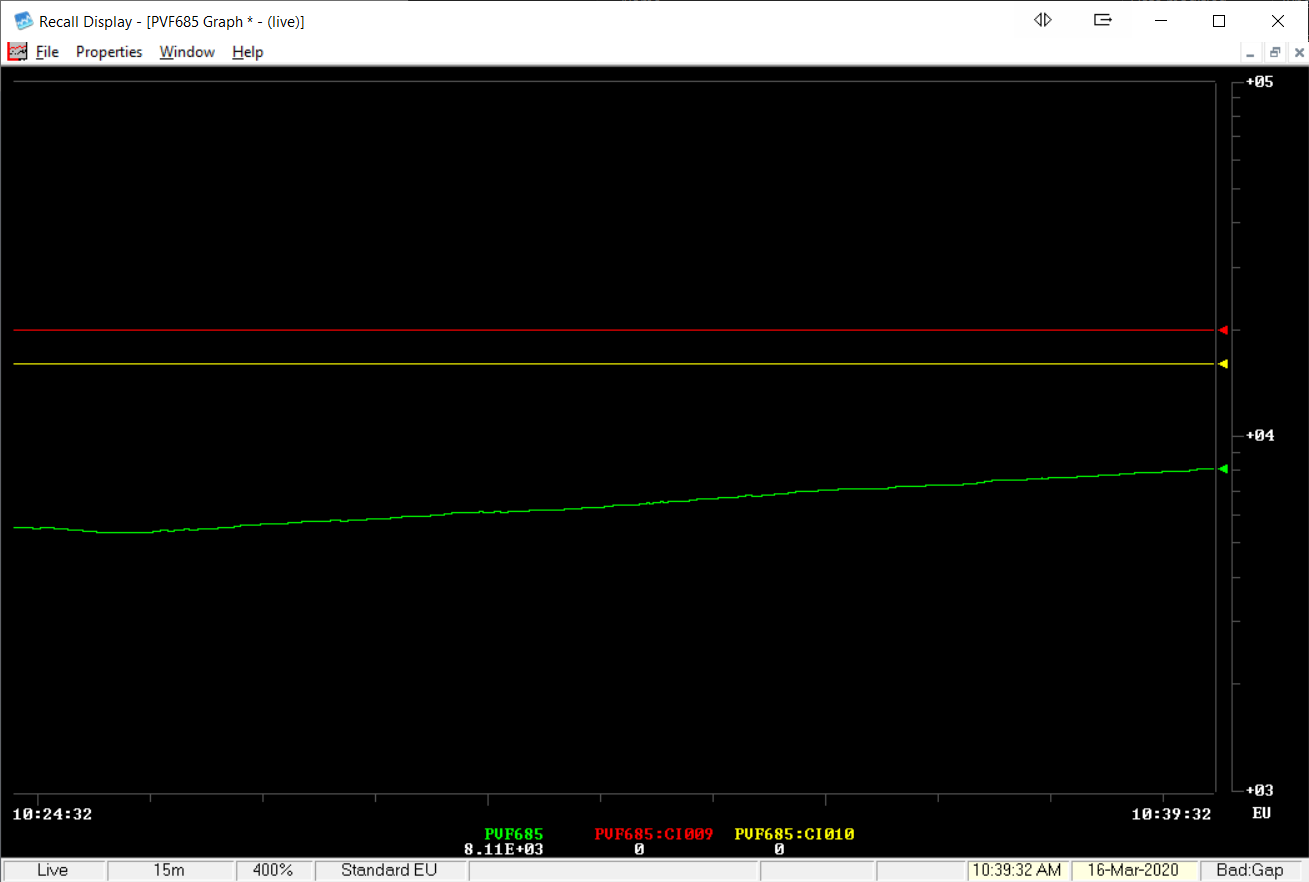
This screen shows a channel's value and alarm set points being graphed over time. This graph may be
created automatically from the channel's context menu.
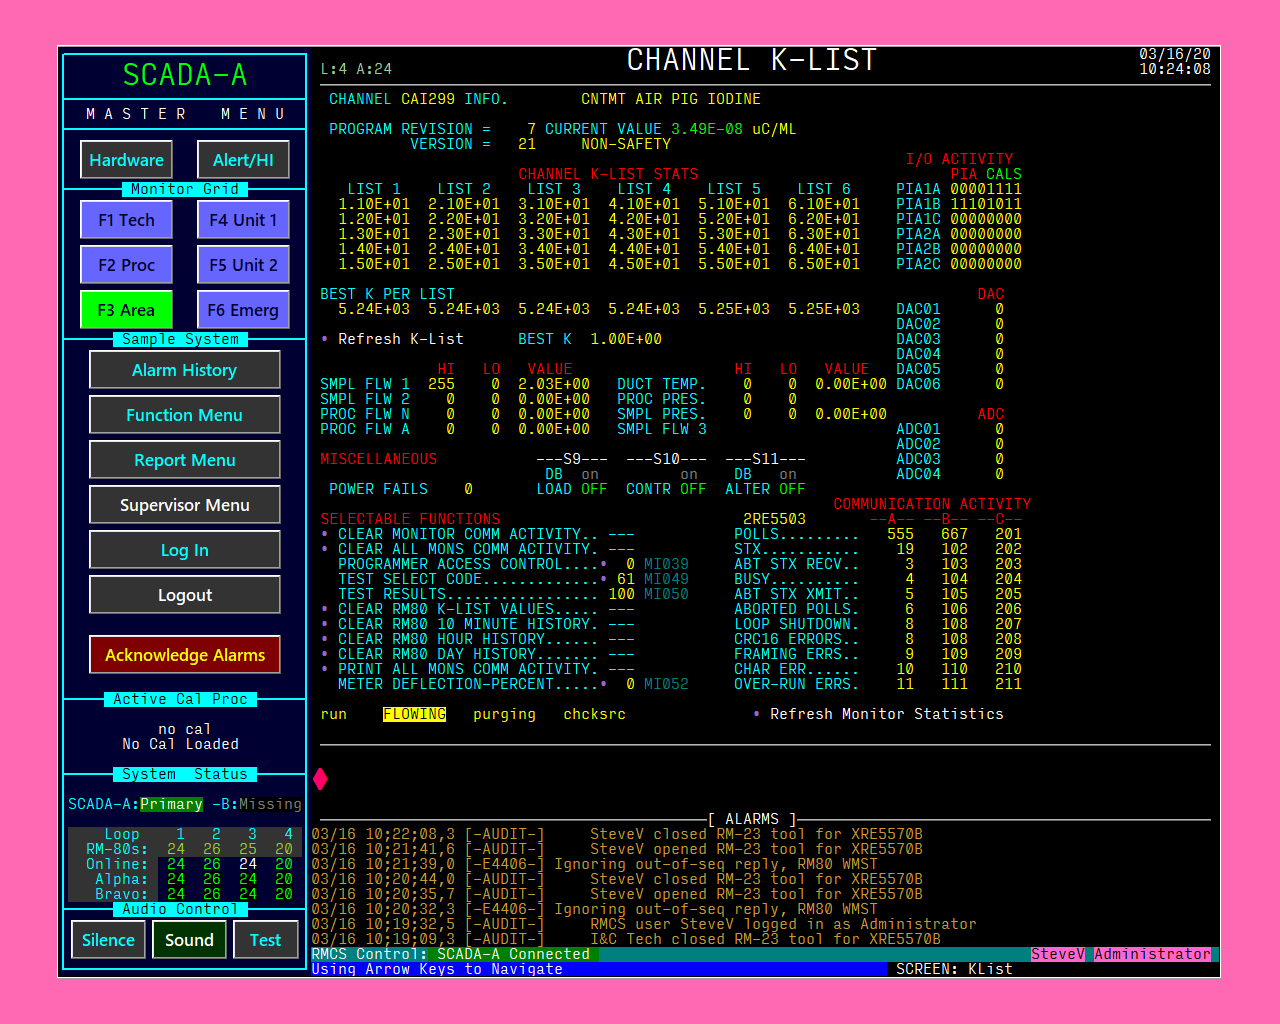
Channel K-List display. This screen also includes all of the data from a Monitor Statistics request
and several monitor items.
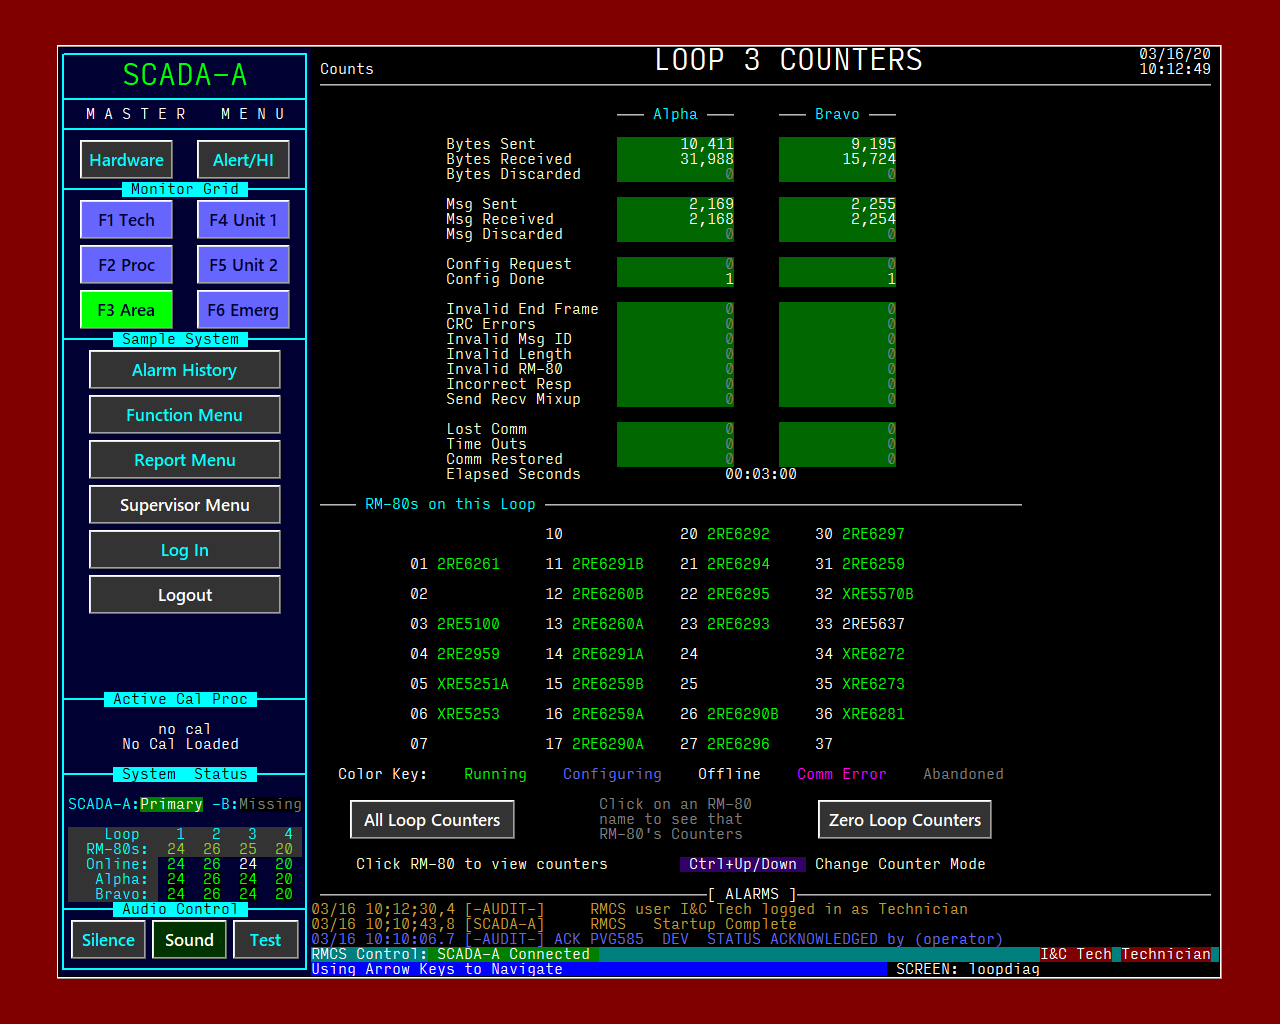
The Loop N Counters screens show all of the counters RMCS maintains for the loop's communication.
A list of RM-80s on the loop are also shown, in a color representing the RM-80's current status.
The RM-80s may be clicked to view the RMCS communication counters for the RM-80.
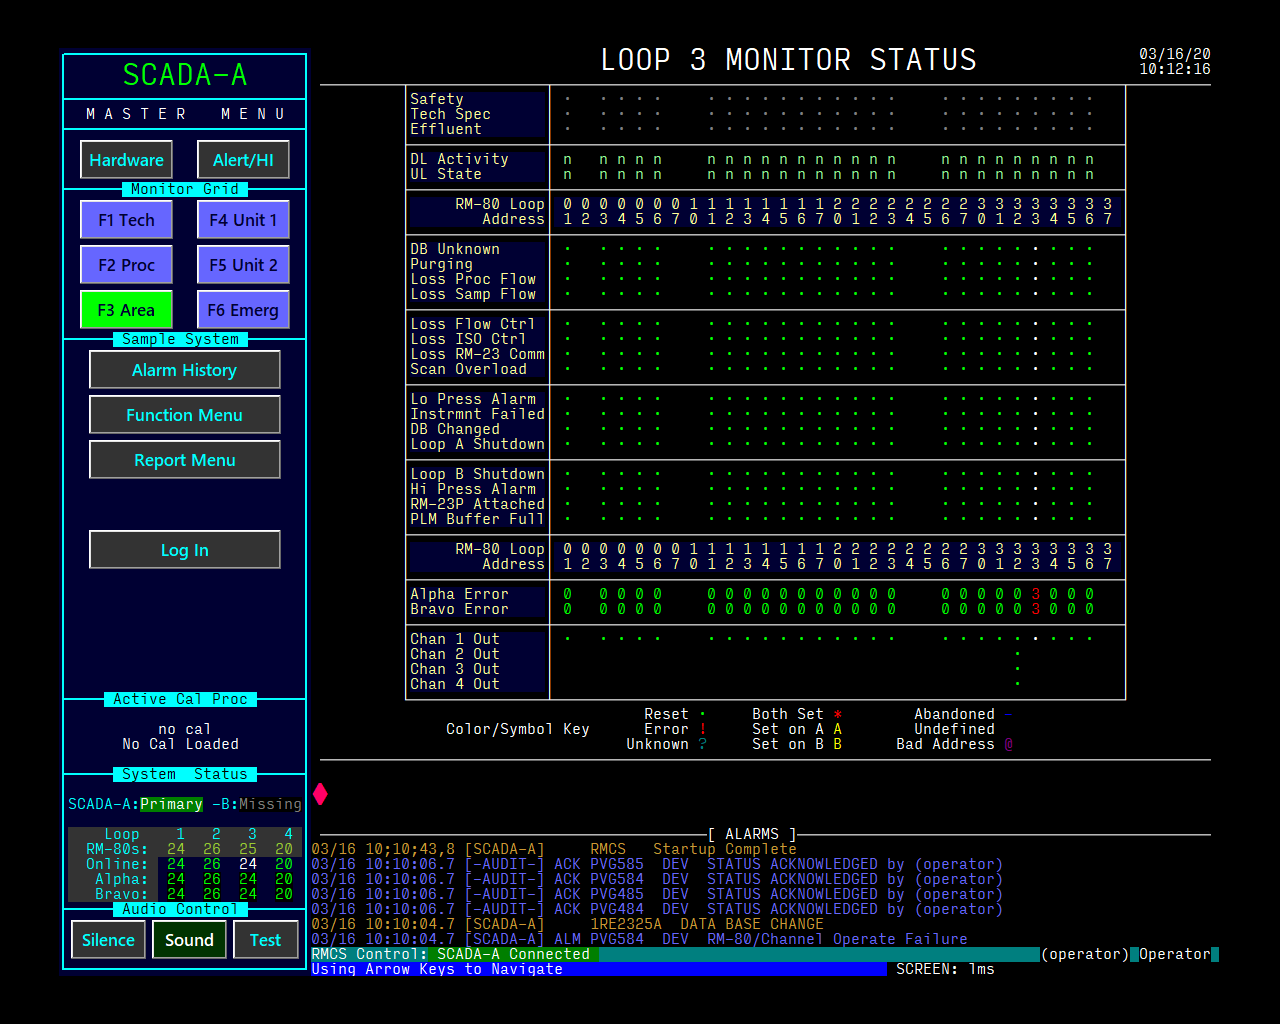
The largest part of the Loop N Monitor Status screens show all of the monitor status bits (MI044) for
ALL of the RM-80s on a loop. The bits may show *, A, or B to indicate that both sides, Alpha or Bravo is
reporting the bit to be set.
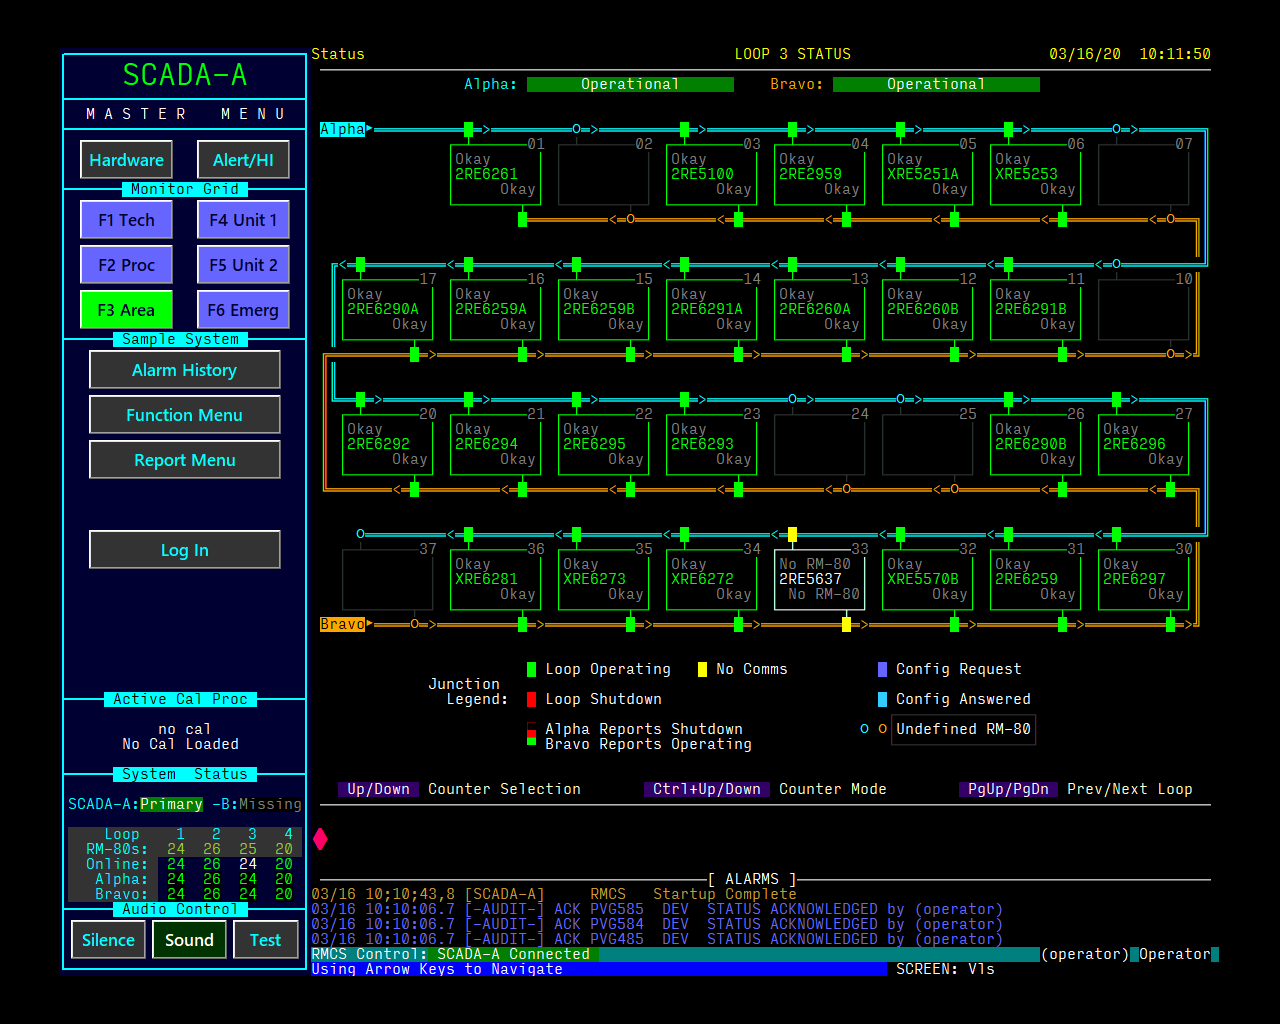
The Loop N Status screens present a stylized diagram of the Alpha and Bravo current loops passing by all
of the RM-80s on the loop. Red loop segments indicate communication issues. The blocks where the RM-80s
connect to the loops are colored by the status coming from the Alpha (top half of the block) and Bravo (bottom
half) loops.
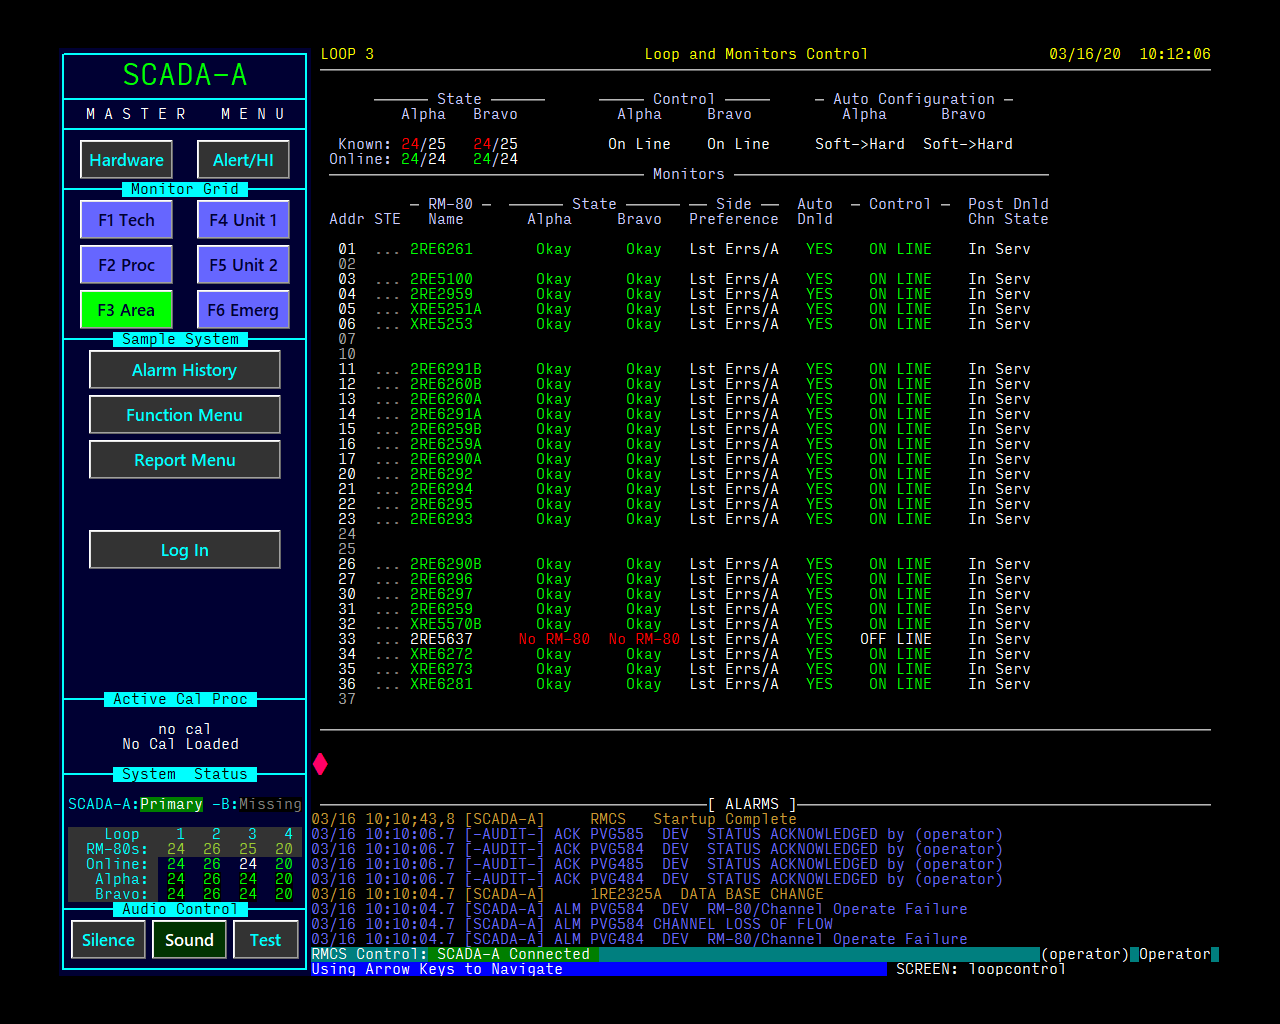
The Loop and Monitors Control screen allows technicians to change some of the configuration settings for
the loops. The screen also provides a different view of the loop's current status using color and state labels
for the RM-80's on each side of the loop.
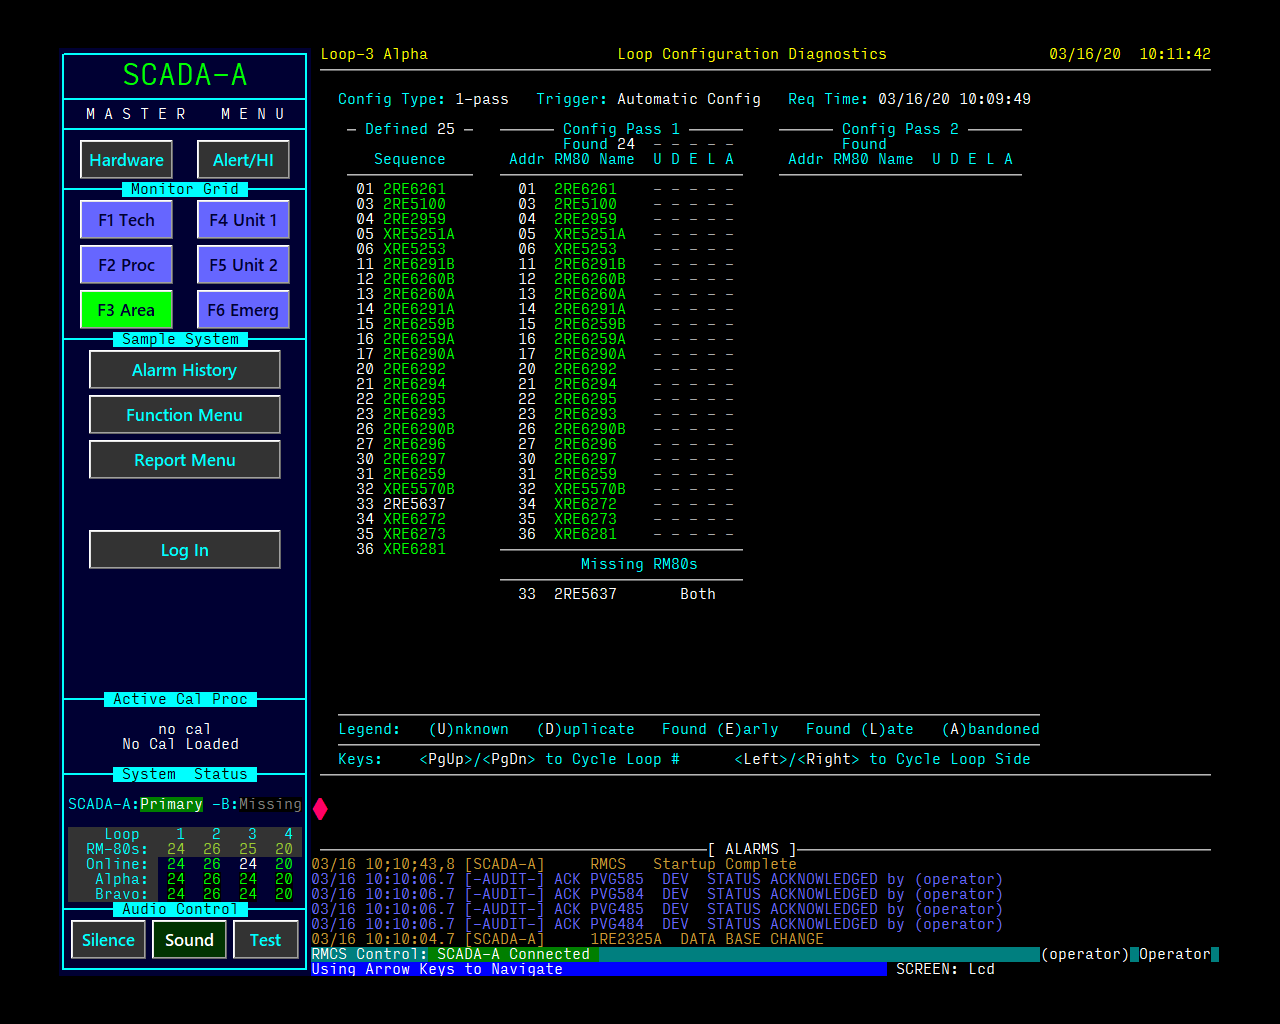
Loop Configuration Diagnostics show the results of the most recent configuration(s) performed on a loop.
This screen is VERY useful for finding loop communication anomalies that occur as a result of incorrect RM-80
address settings (or physical position) on a loop.
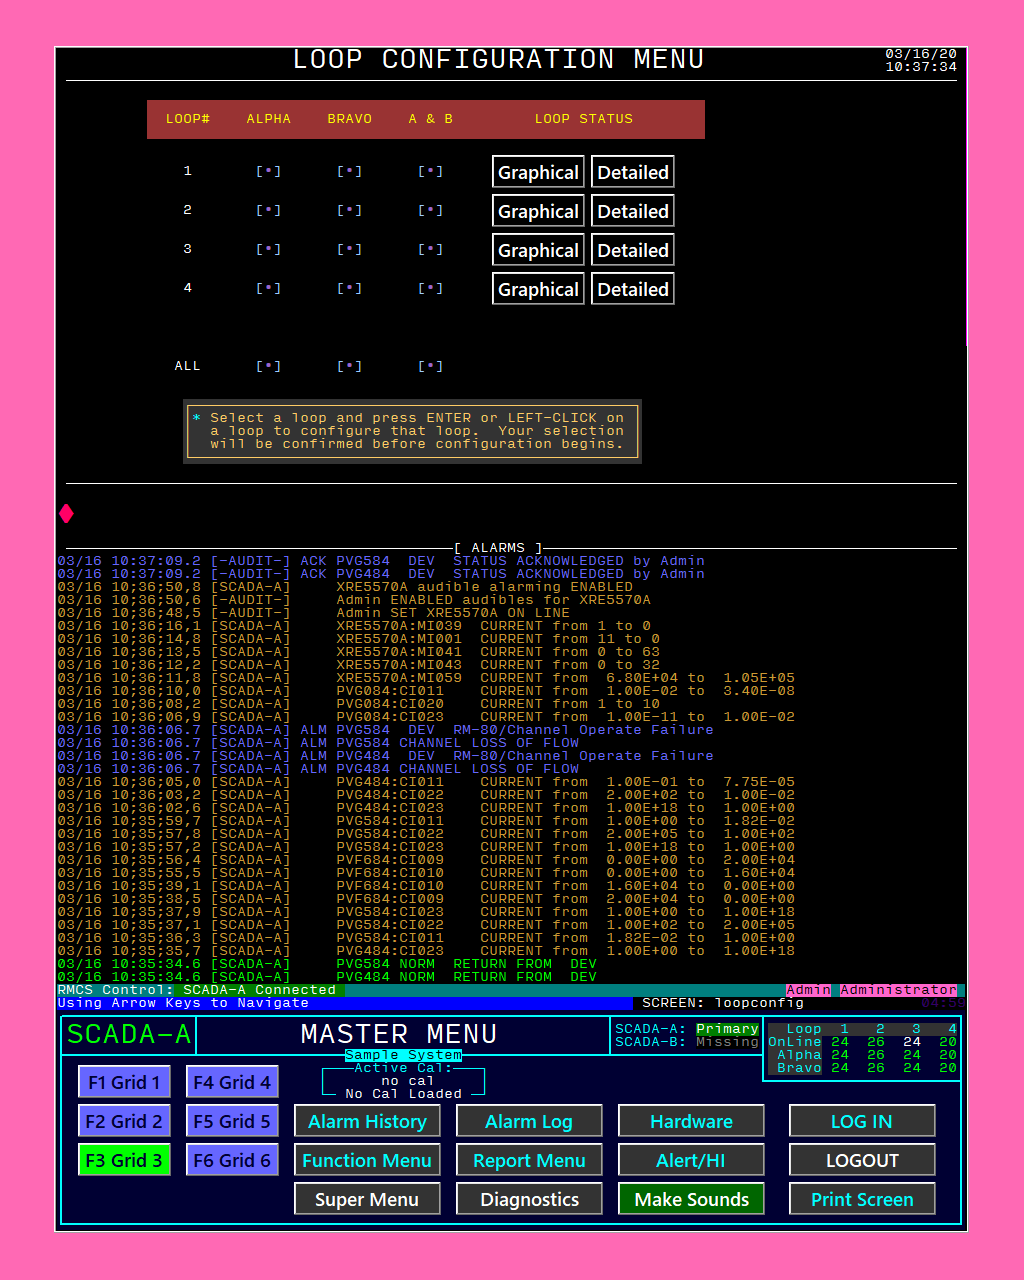
The Loop Configuration menu provides a way to trigger multiple configuration events at the same time.
This sample also demonstrates RMCS Display running in Portrait mode instead of Landscape mode as
used by most other example screens.
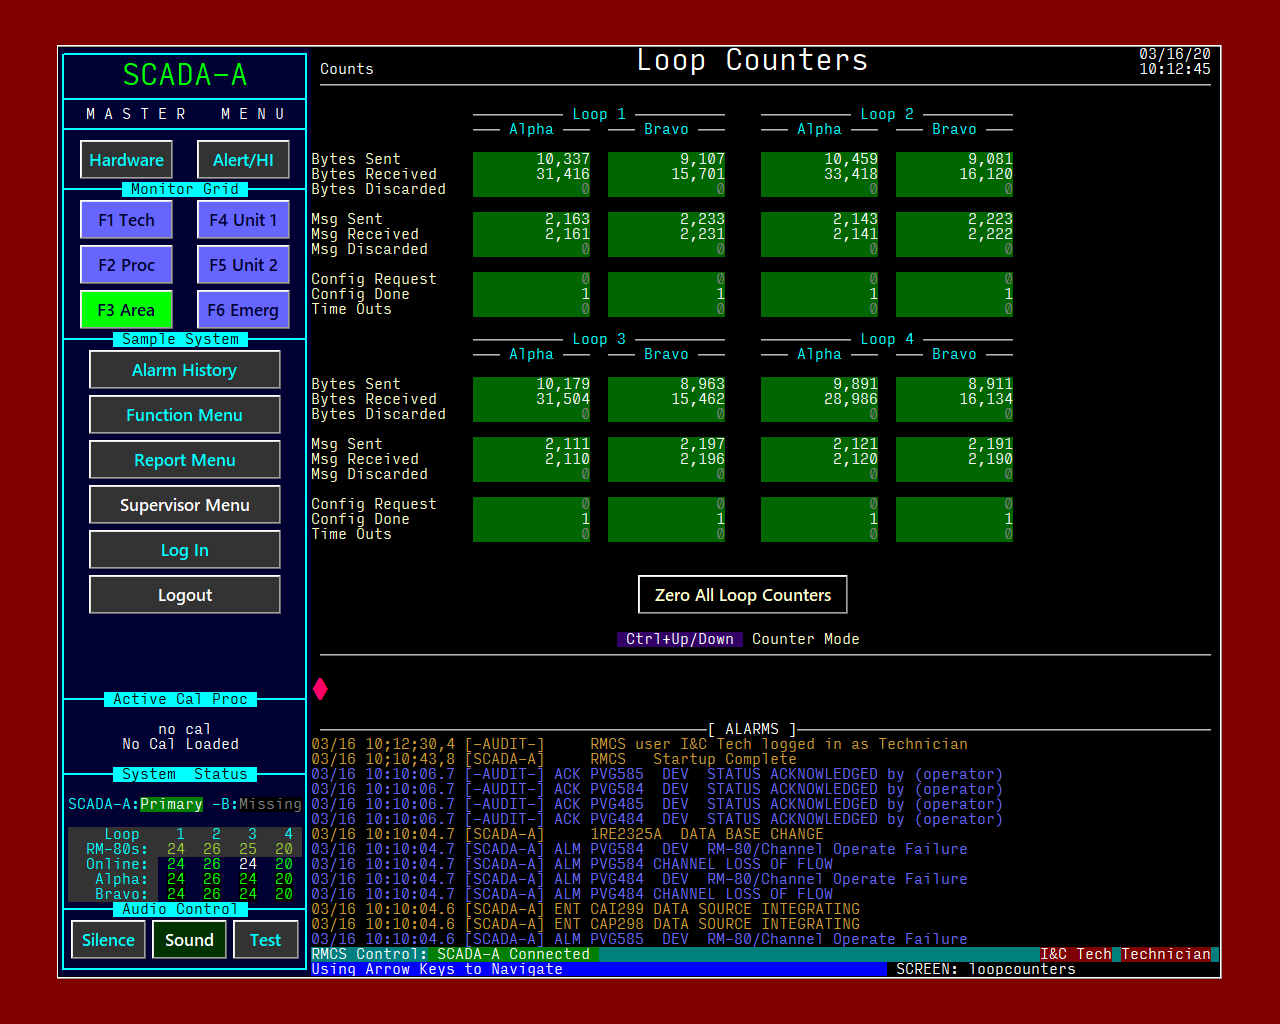
The Loop Counters screen shows "highlights" of the RMCS Loop communication counters for
EVERY loop on a single screen.
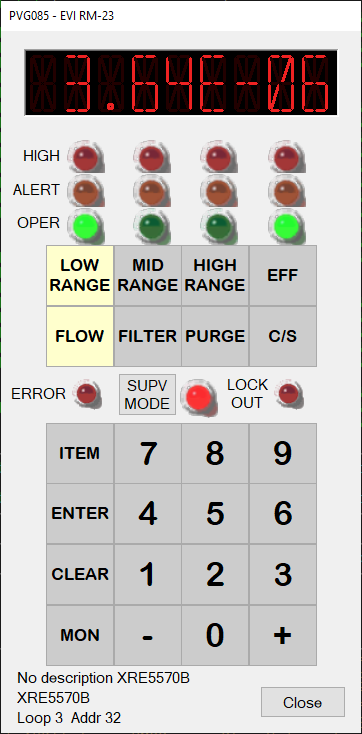
RMCS Display includes an RM-23P mimic dialog that may be useful for customers using RMCS to connect
to the RM-23 (Charlie) port on an RM-80. By mimicking a known device, training requirements are much lower.
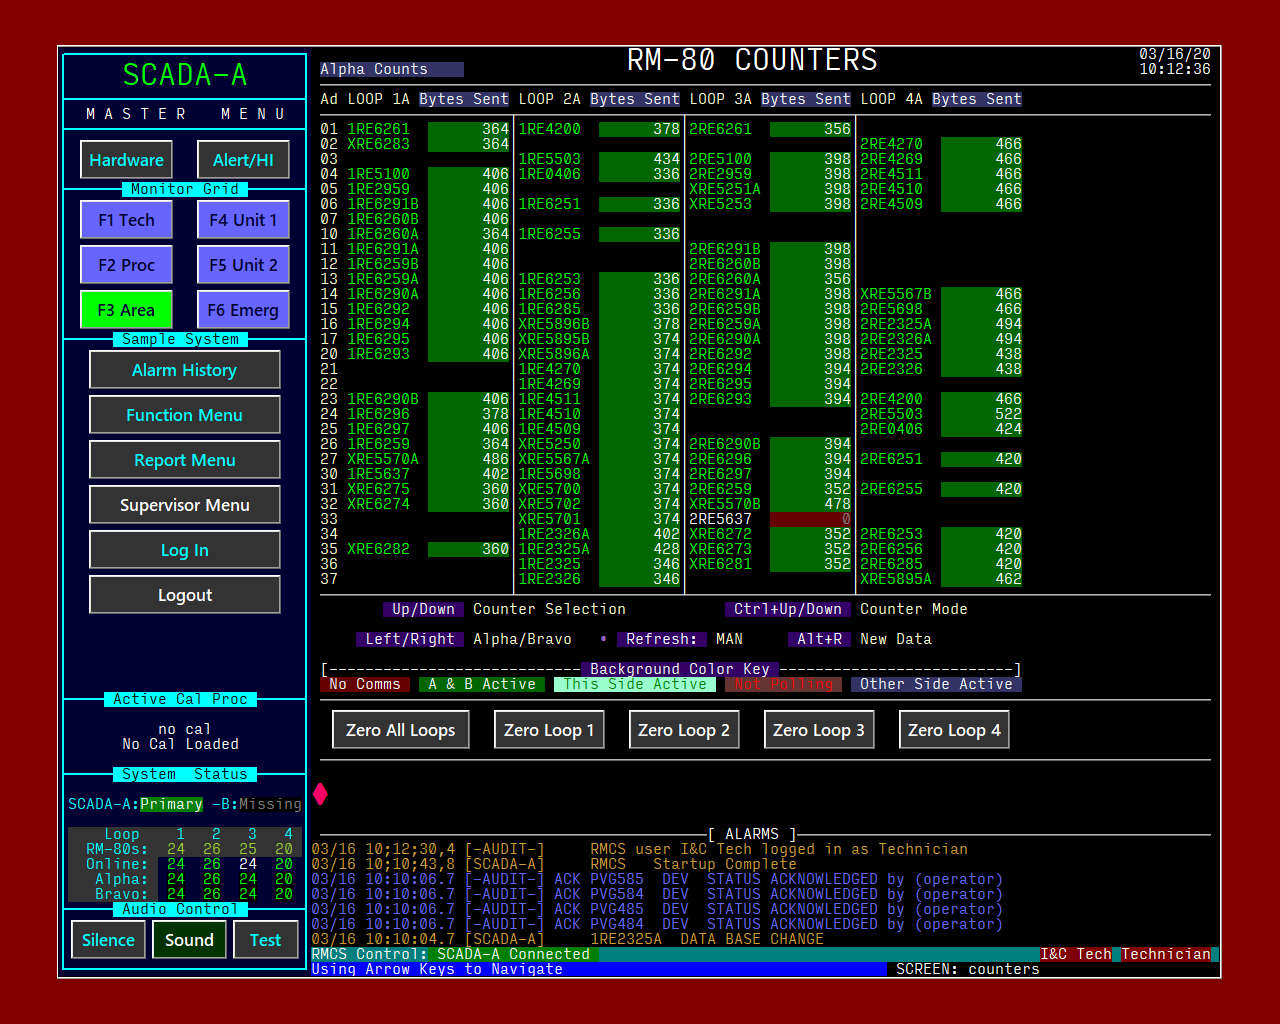
There are times when it is useful to compare for the RM-80s on a loop. This screen allows the user
to see a single counter (one at a time, but any counter may be selected) for ALL RM-80s in RMCS at the
same time. When looking for communication issues, we typically zero a loop's counters and look for the
RM-80(s) that are significantly different from the rest.
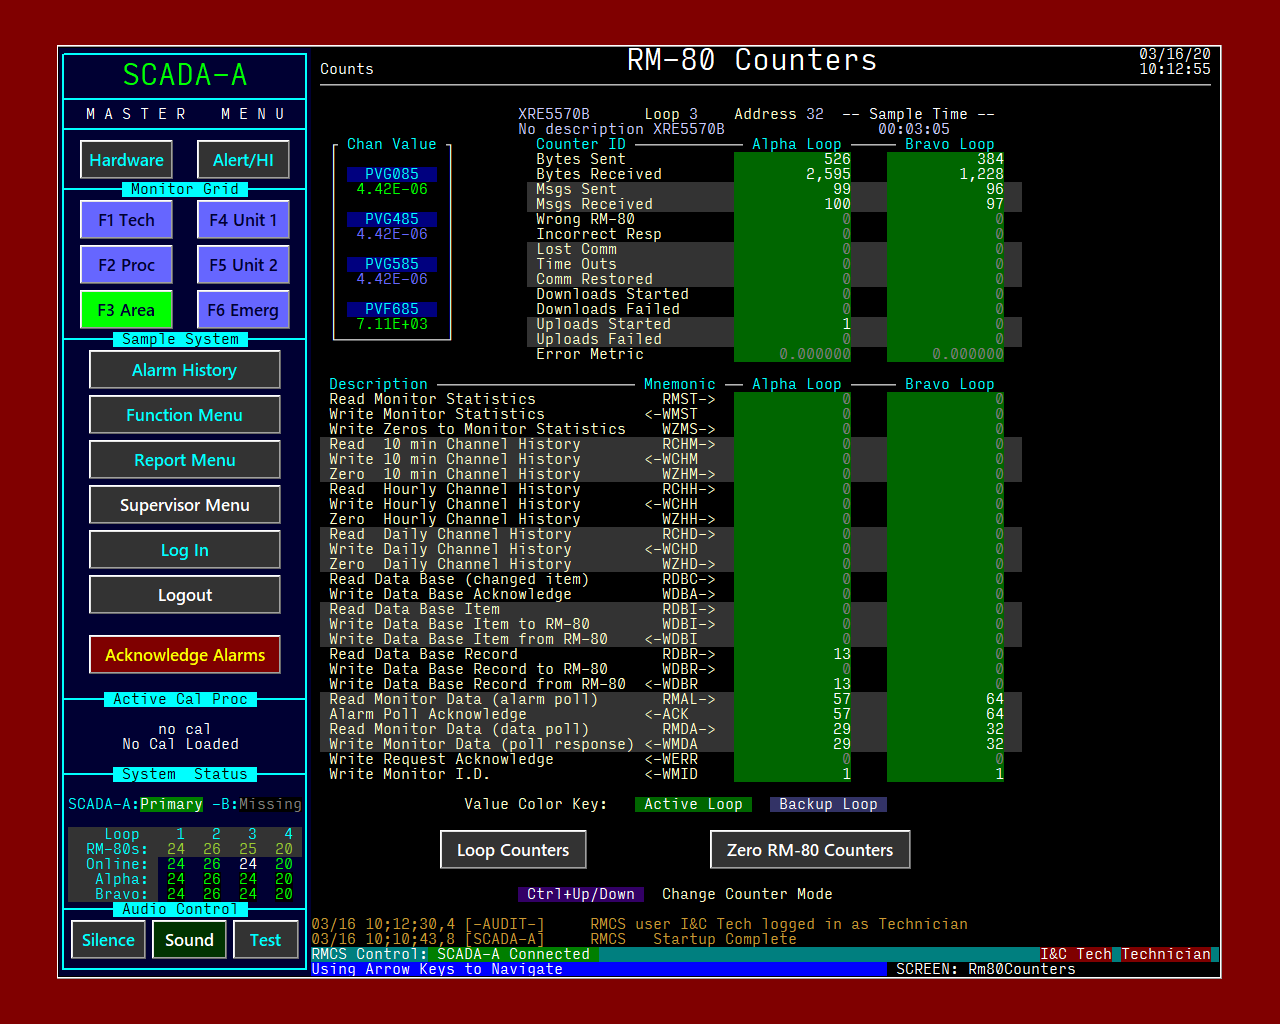
The RM-80 Counters screen shows all of the counters for a single RM-80, including counters for all
of the RM-80 communication protocol messages.
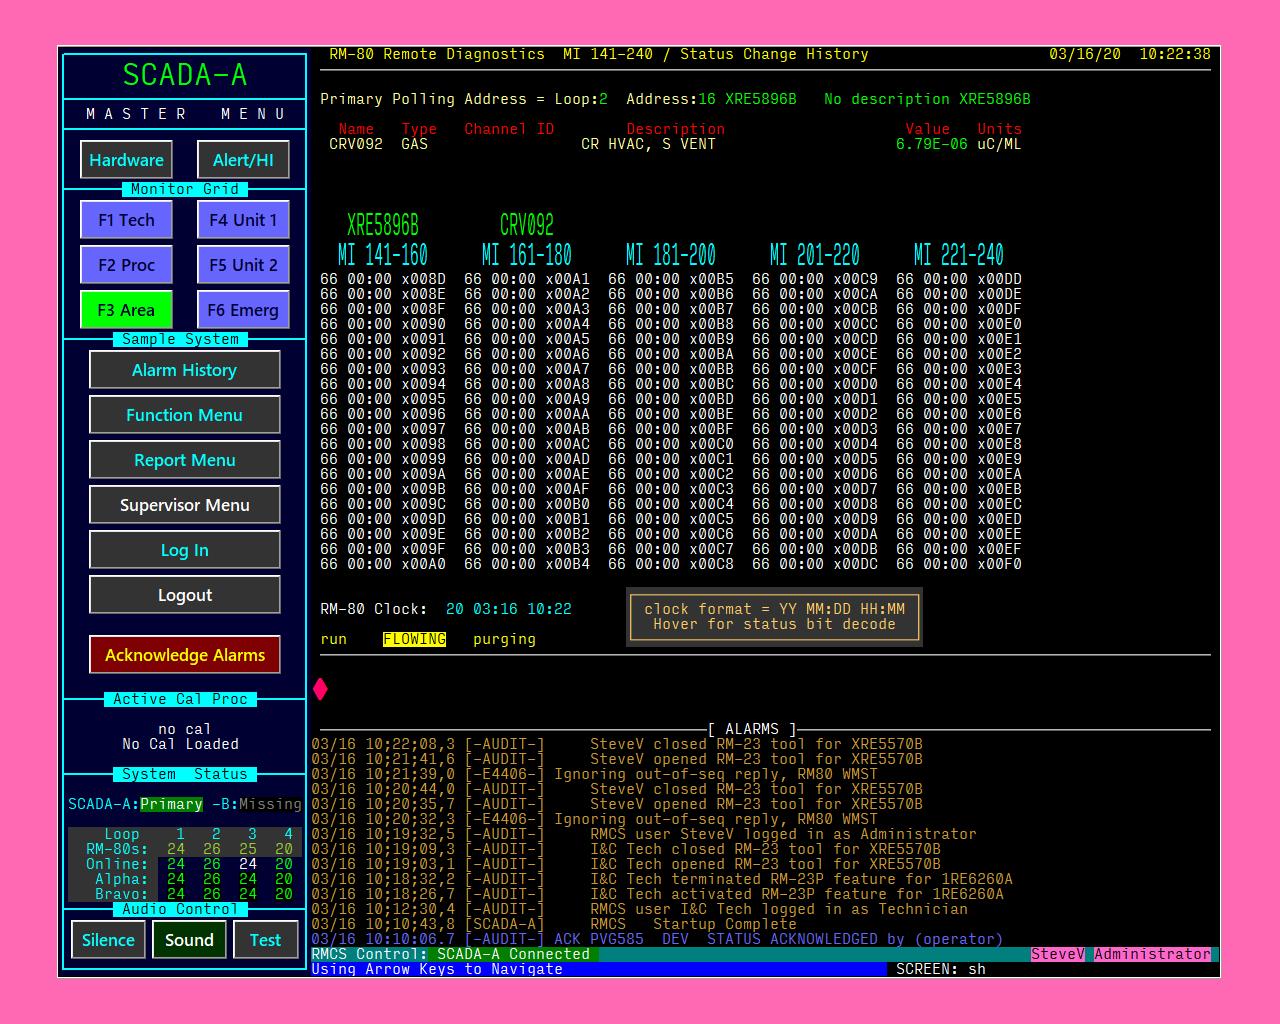
The Status Change History screen is an example of a screen that was created using RMCS Display's
advanced screen layout capabilities. The screen shows the last twenty status changes for the RM-80
and all of the RM-80's channels.
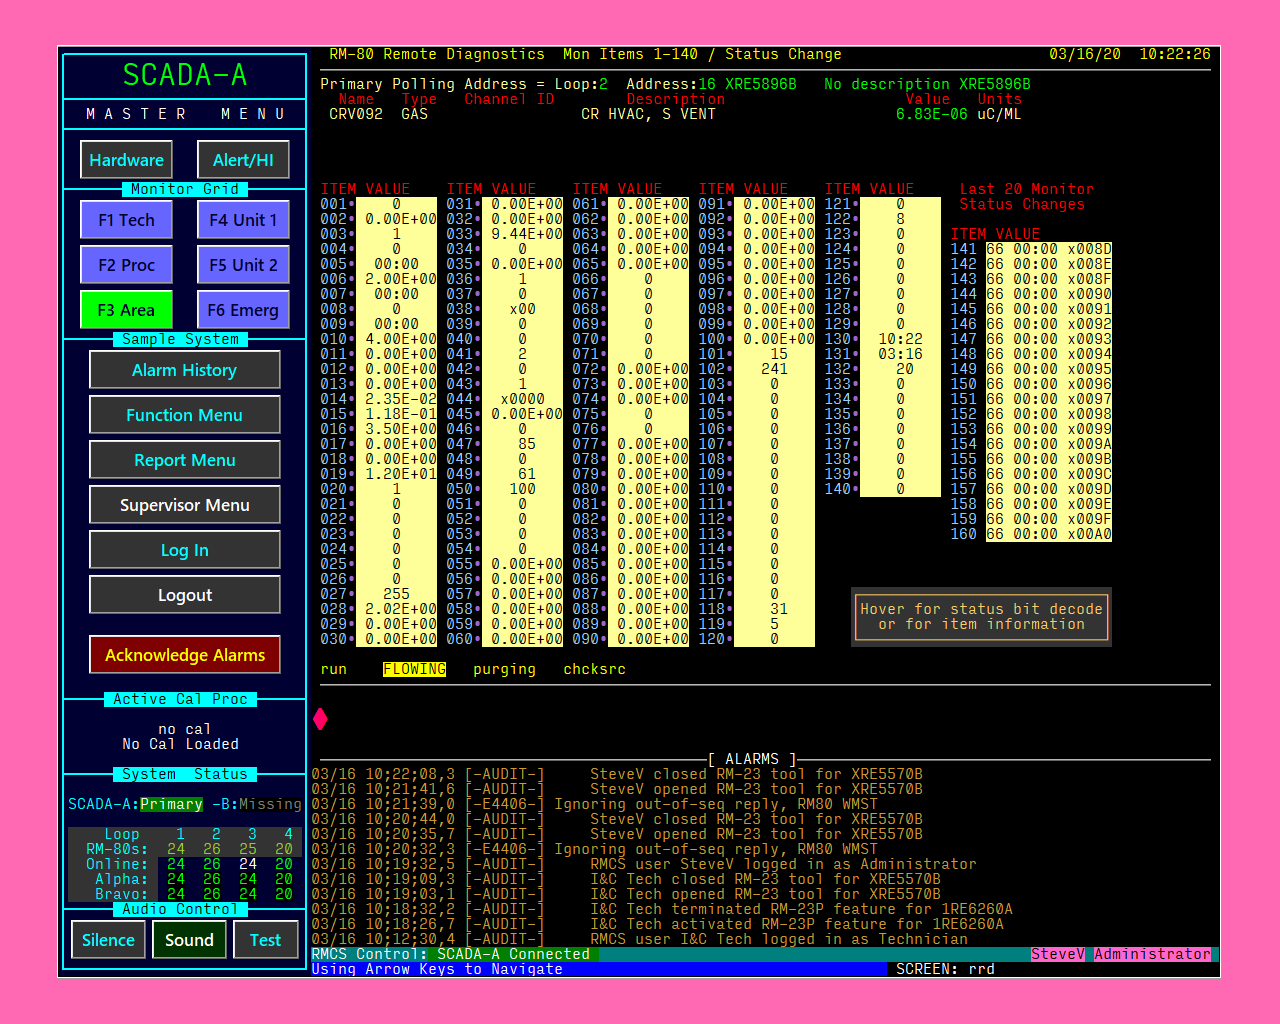
The Remote Diagnostics screen is an example of a screen that was created using RMCS Display's advanced
screen layout capabilities. The screen shows monitor items 1 to 140 and the last twenty monitor status
changes. Some RM-80s will only provide items 1 to 60 -- on those monitors all other values will display
an error.
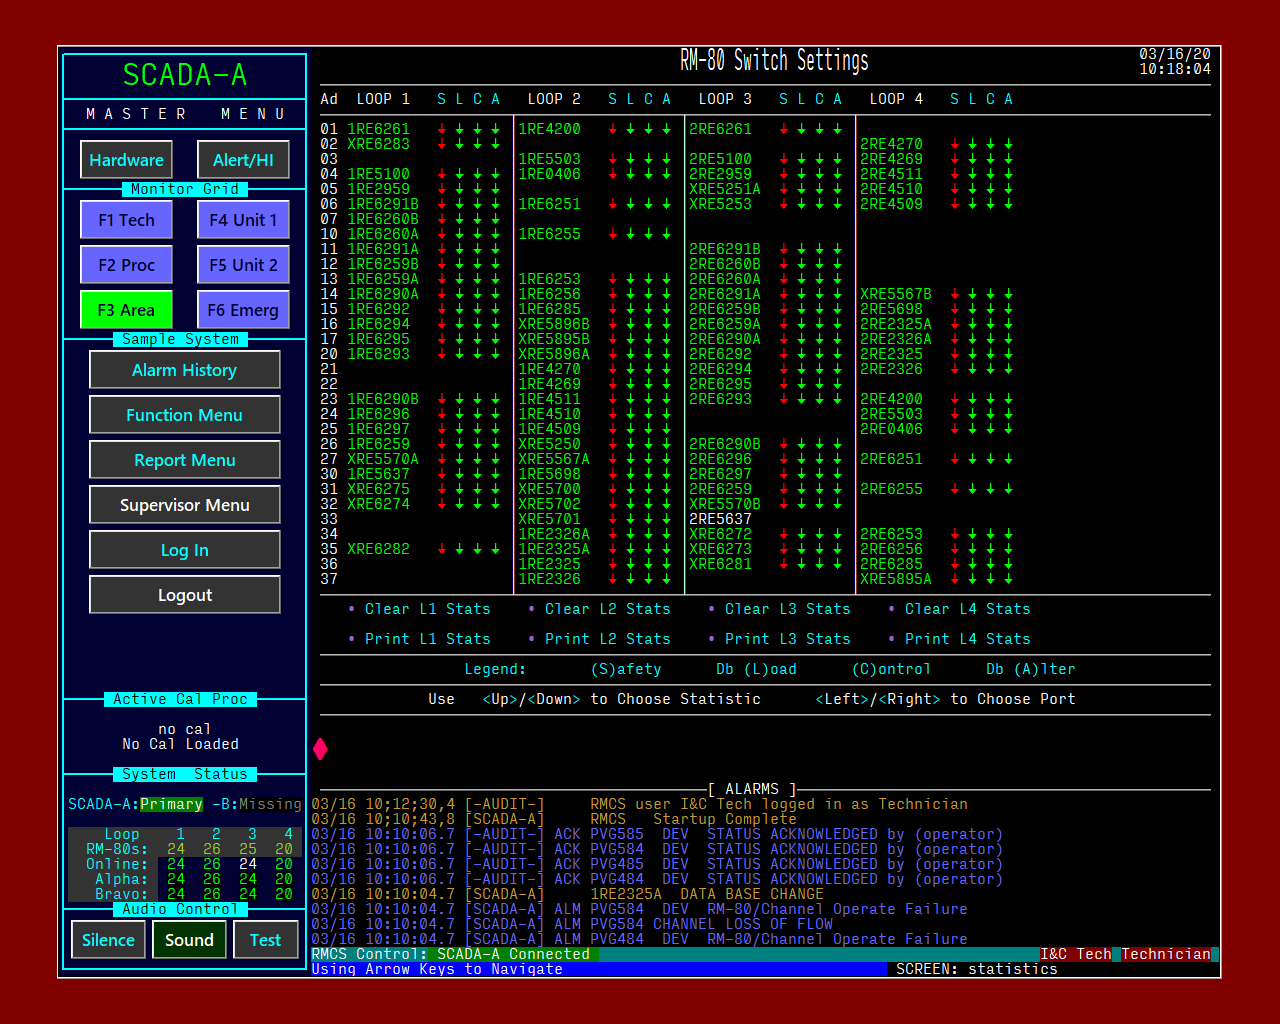
The statistics screen collects Monitor Statistics from ALL RM-80s on ALL Loops and displays one
statistic value at a time on the screen. This sample shows a decode of the switch bits from PIA1A.
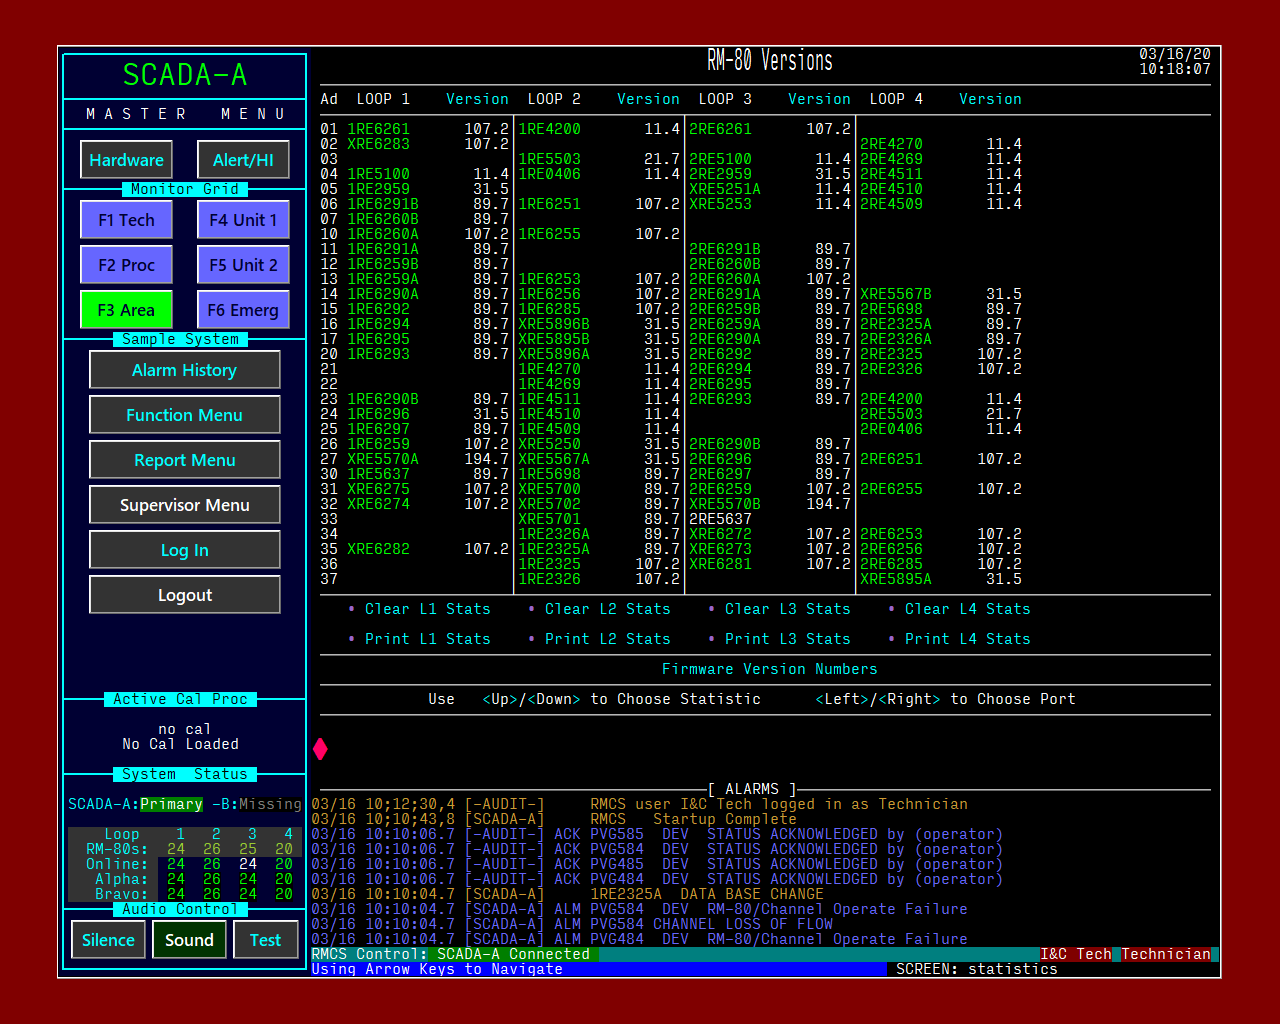
The statistics screen collects Monitor Statistics from ALL RM-80s on ALL Loops and displays one
statistic value at a time on the screen. This sample shows Version.Revision values.
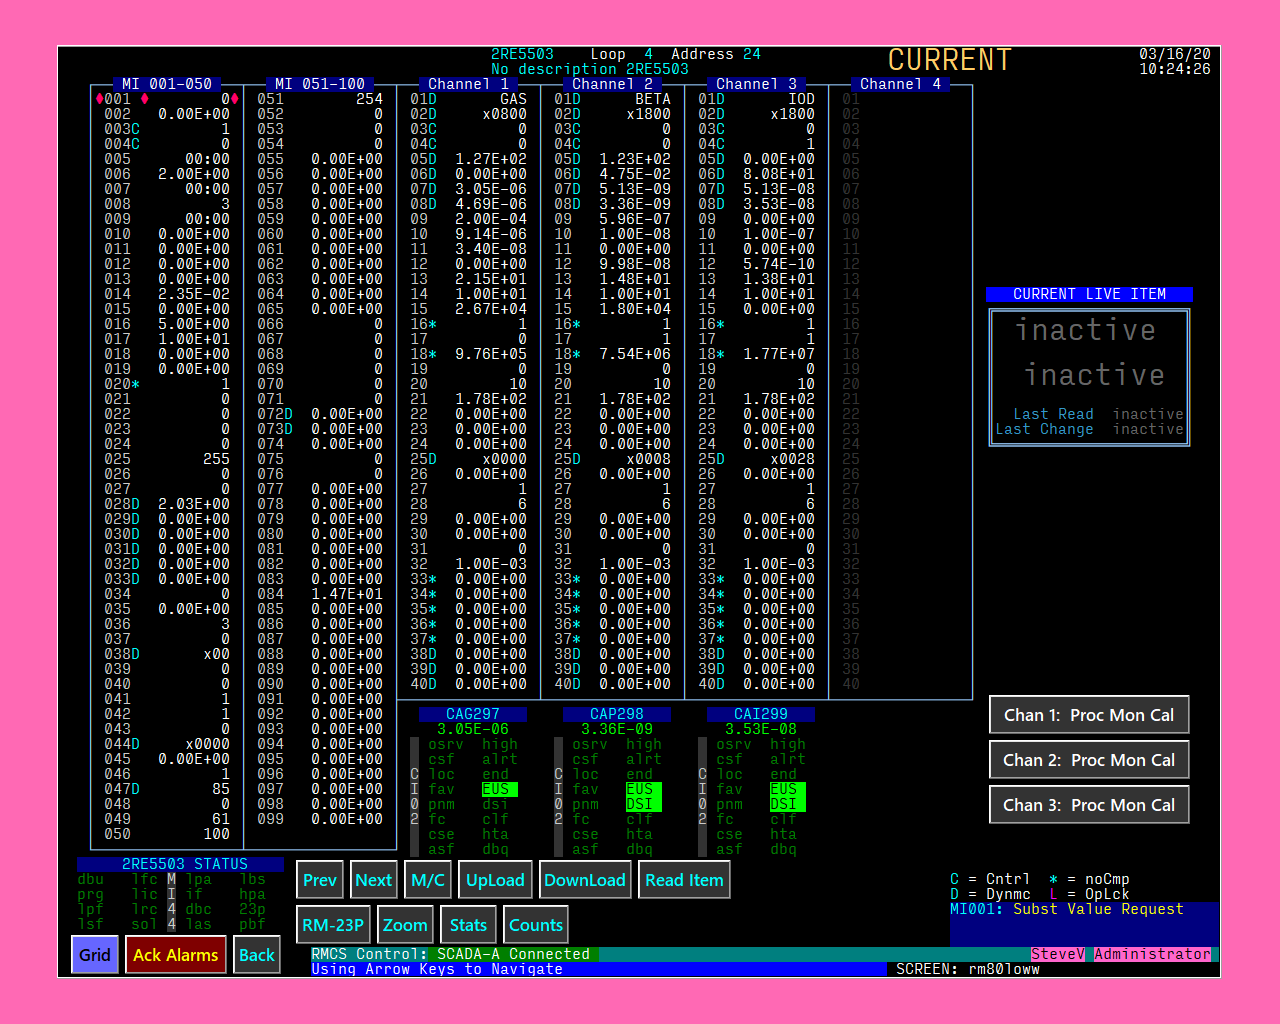
The RM-80 Database screen allows a technician to see all of the uploaded/downloaded monitor and
channel items. Non-dynamic items may be edited by double-clicking, though final approval for the
change is up to the RM-80.
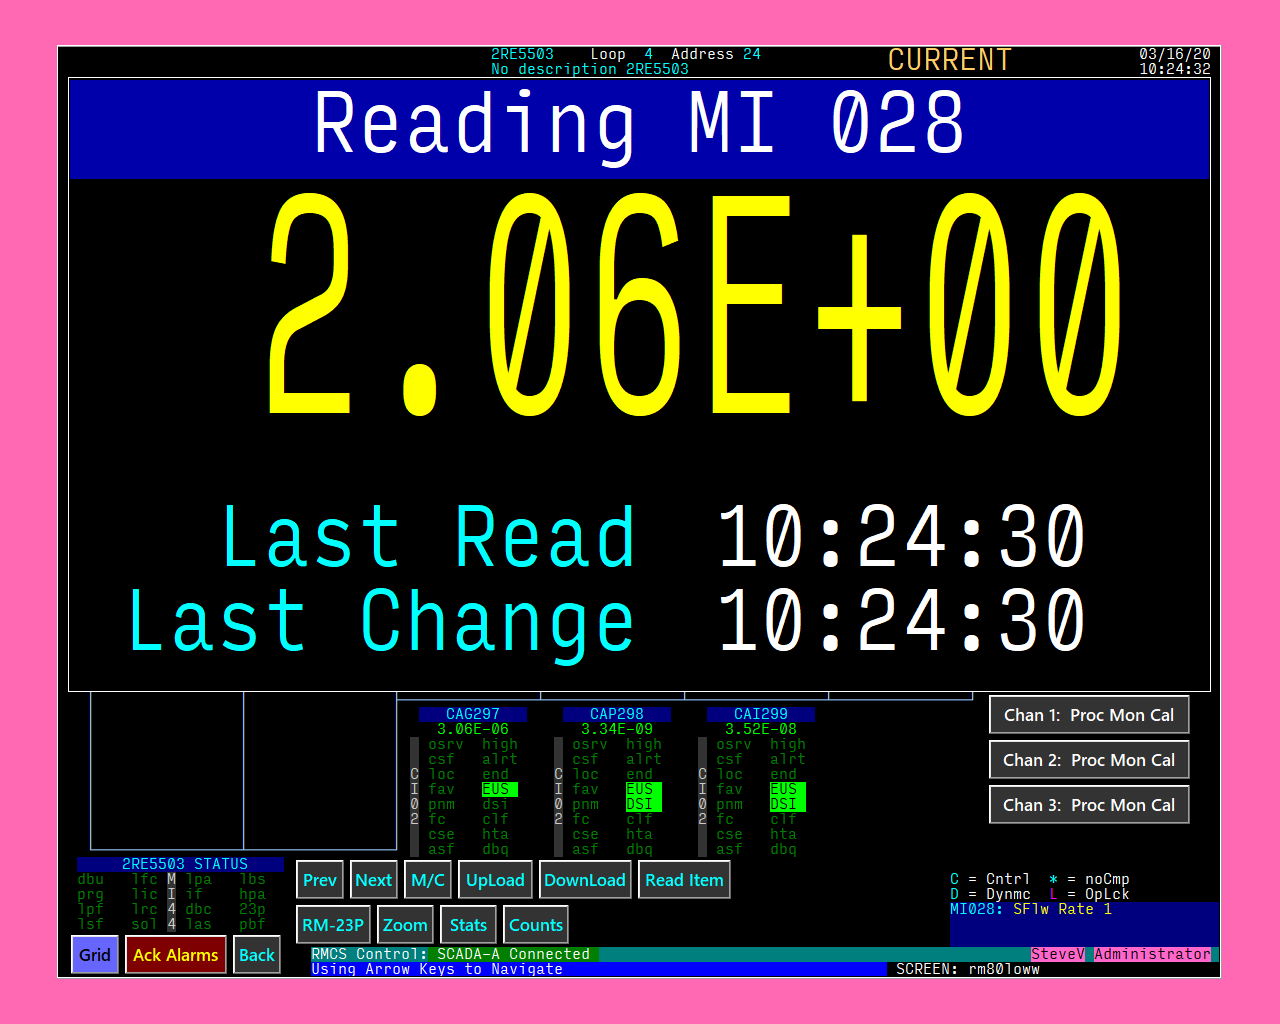
This example shows the Zoom function on the RM-80 database screen in use. This allows a
technician to monitor a specific item value from a distance while working on an RM-80.
Customer Requested/Designed Screens and Features
These screens were designed using input from customers in order to meet specific local needs.
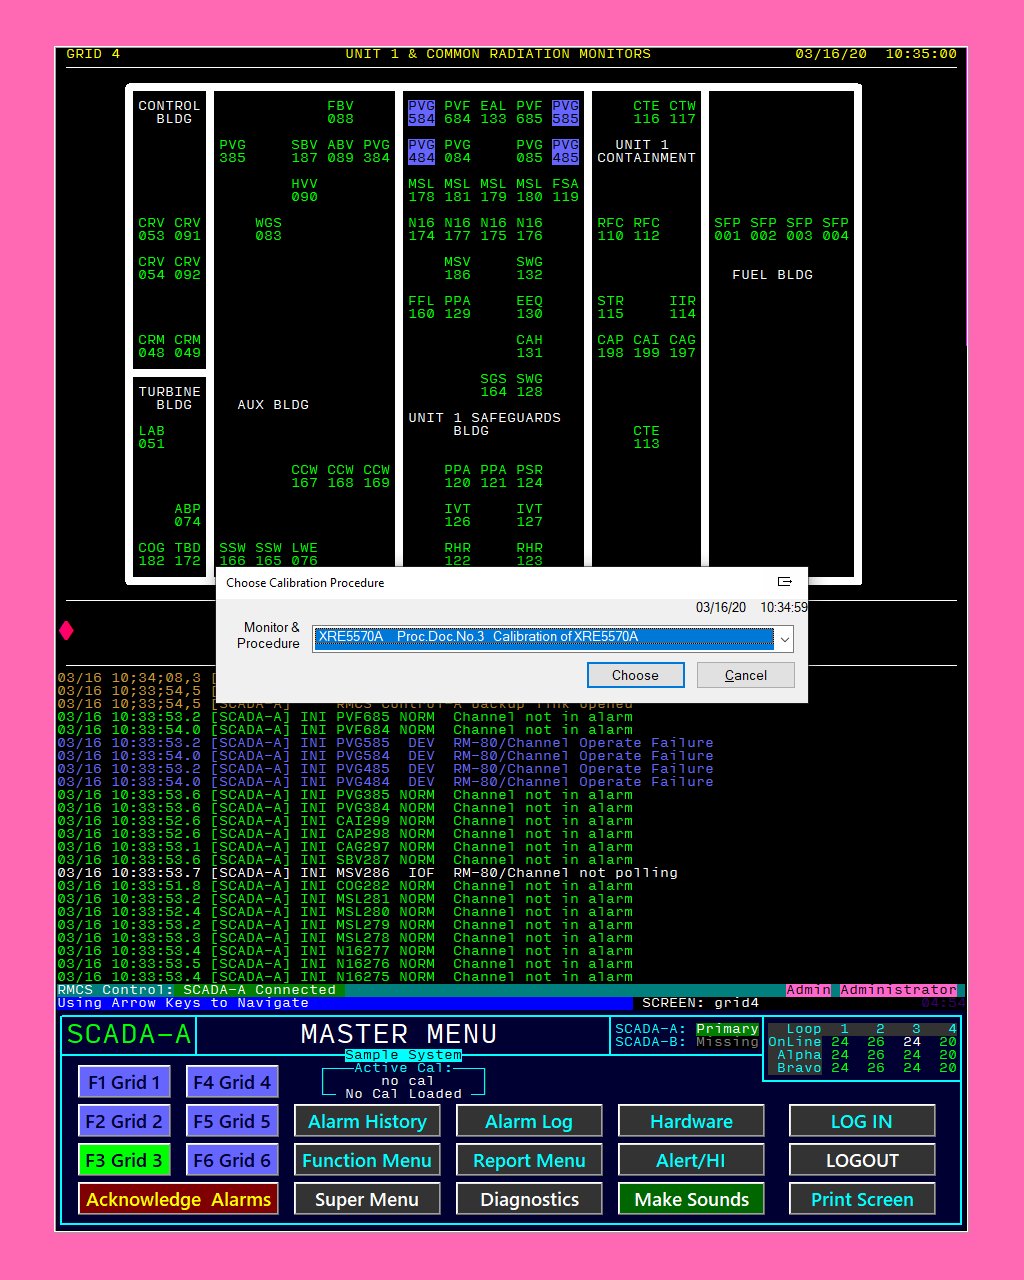
The Calibration Chooser provides a list of all currently known calibration procedures to choose from.
Making a selection loads the procedure data and then activates the Calibration Manager.
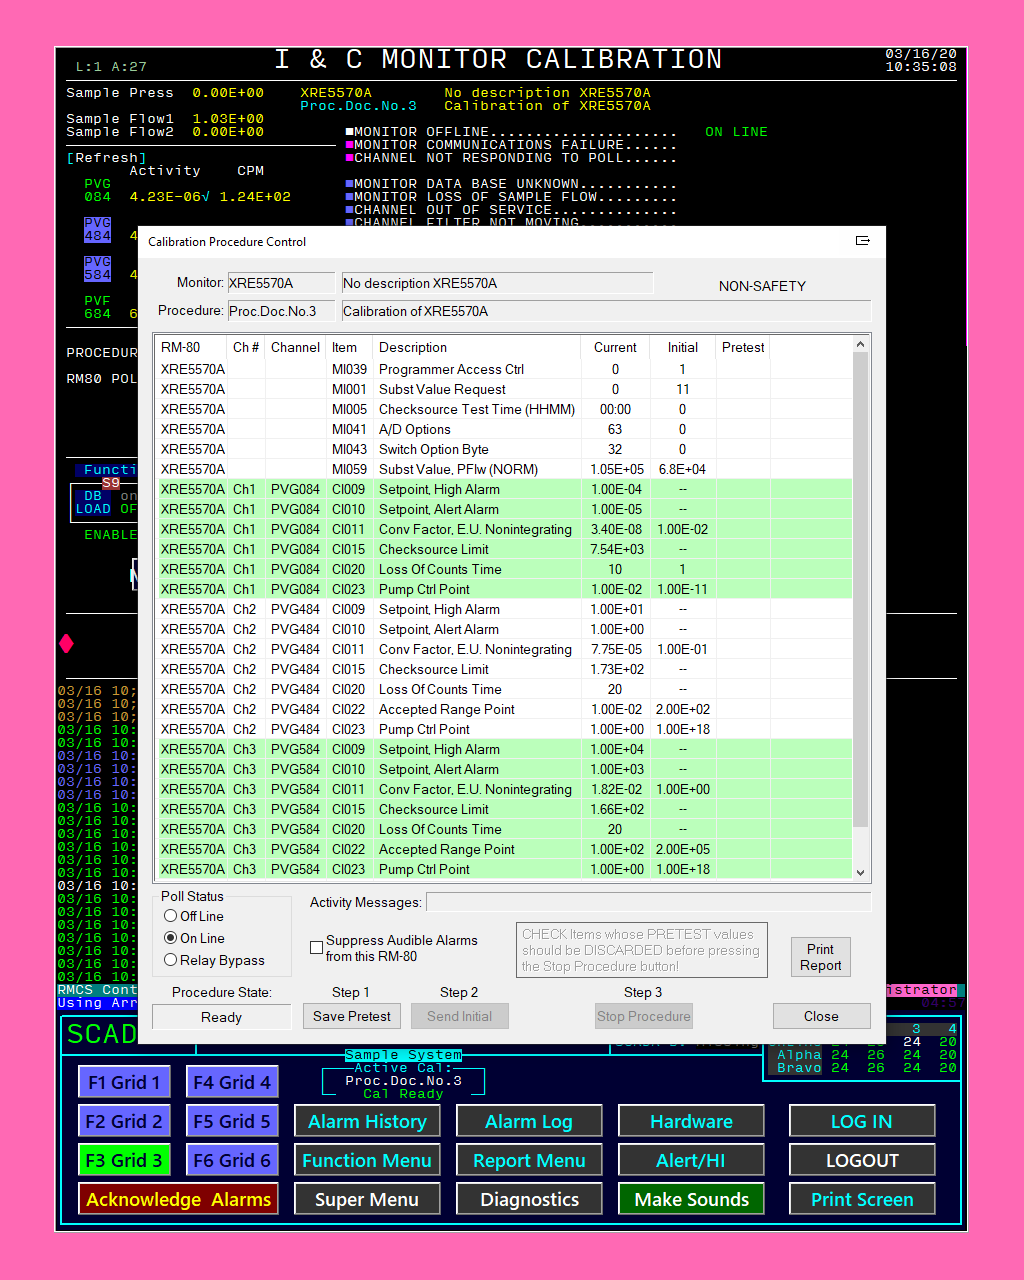
The tool shown here is the Calibration Procedure Control dialog. This calibration support system was
designed by working with a customer to determine what would be the best way to improve the way technicians
interact with RMCS during calibration procedures. This allows current item values to be saved, initial
values to be applied and then the original values to be restored while keeping any required changes.
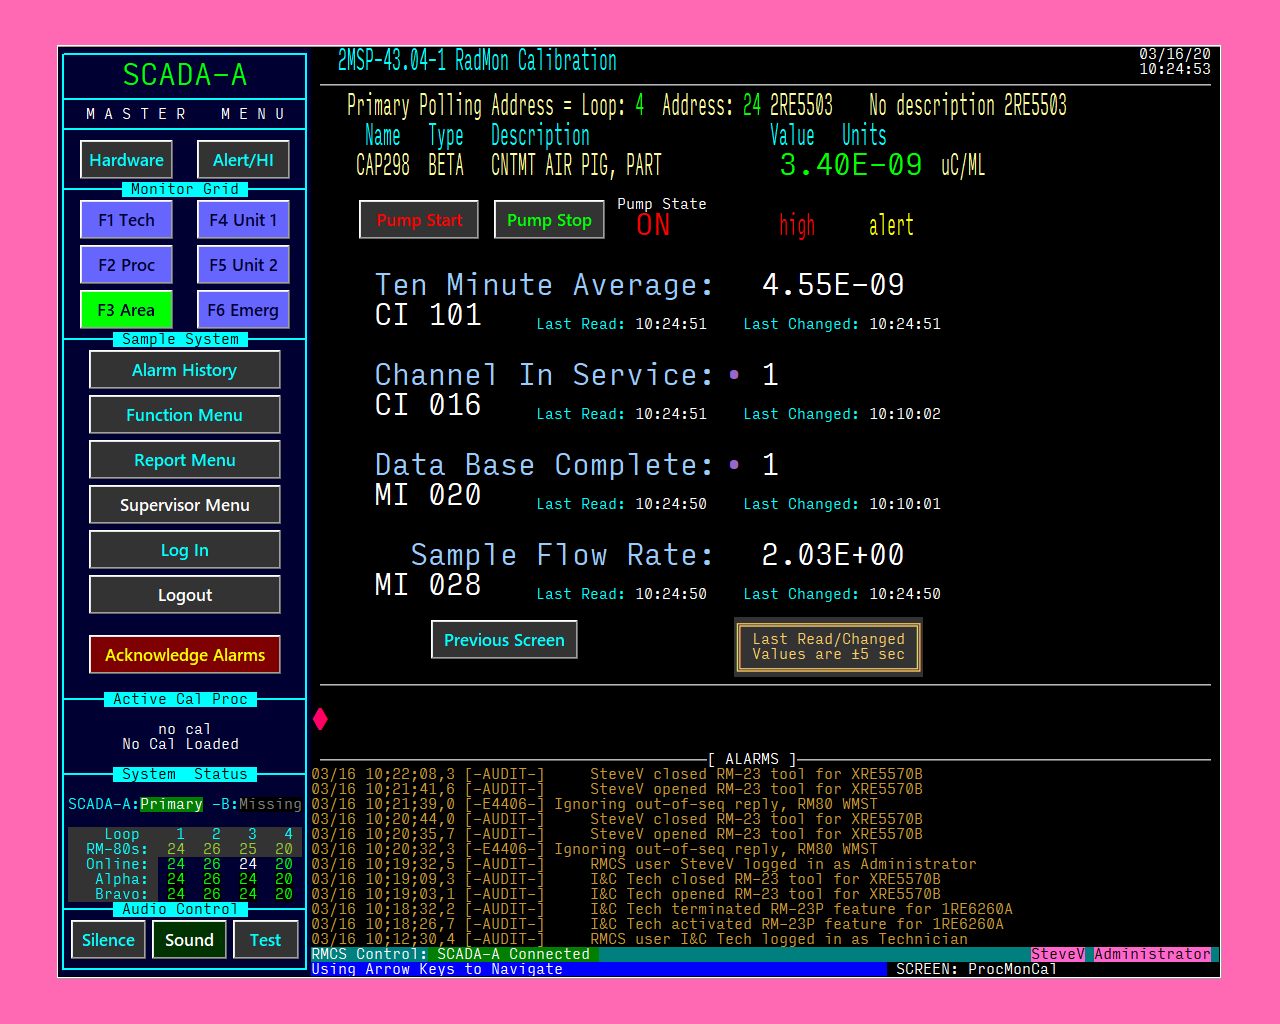
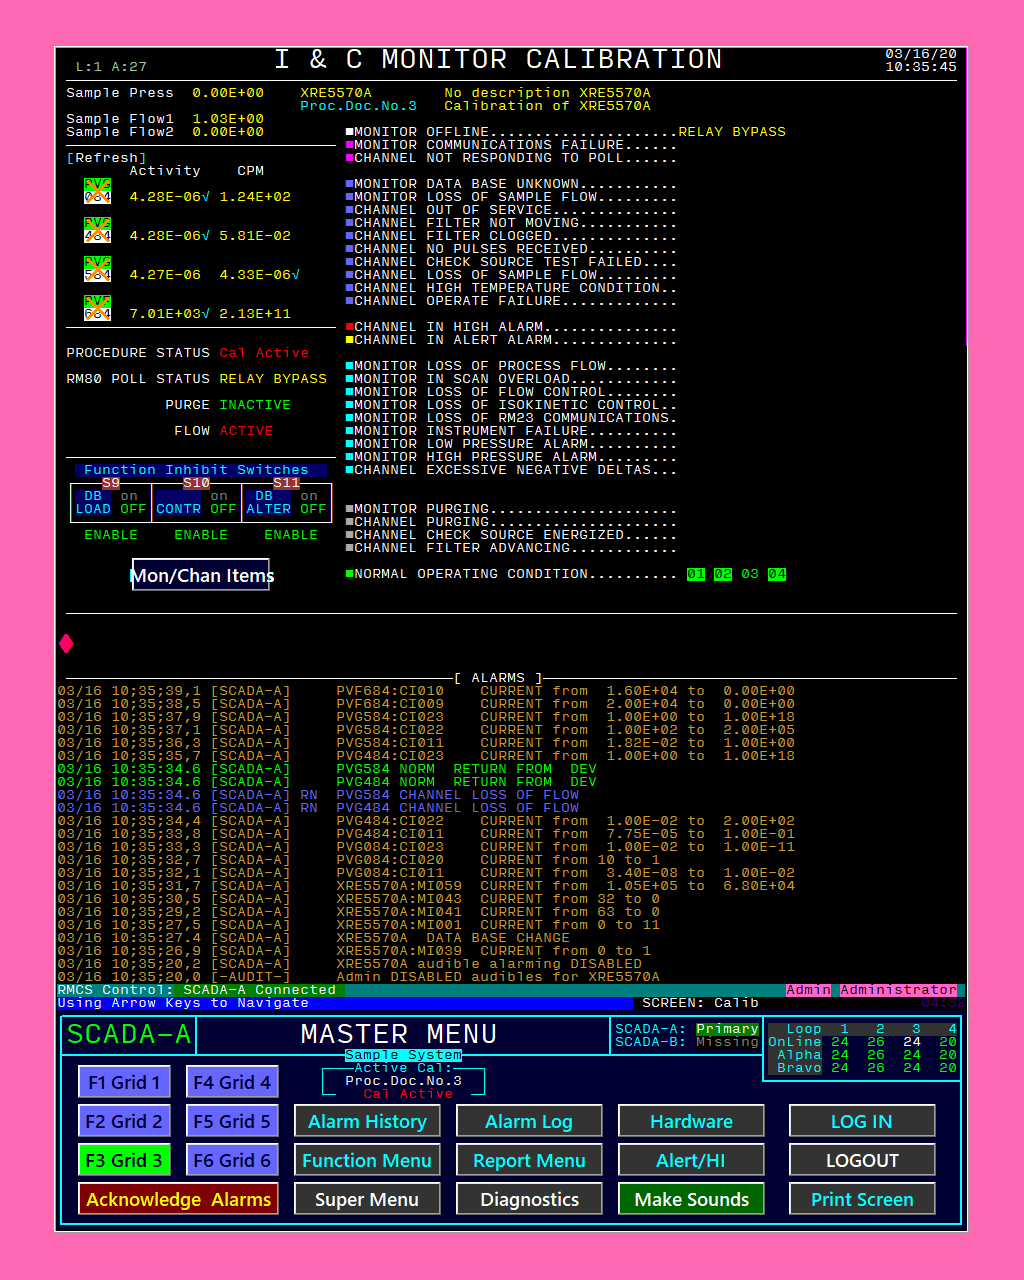
This radiation monitor calibration screen was designed using customer input in order to support the
customer's calibration procedures.
This screen was designed by a customer's technicians to include all of the things they typically use
during a calibration procedure.
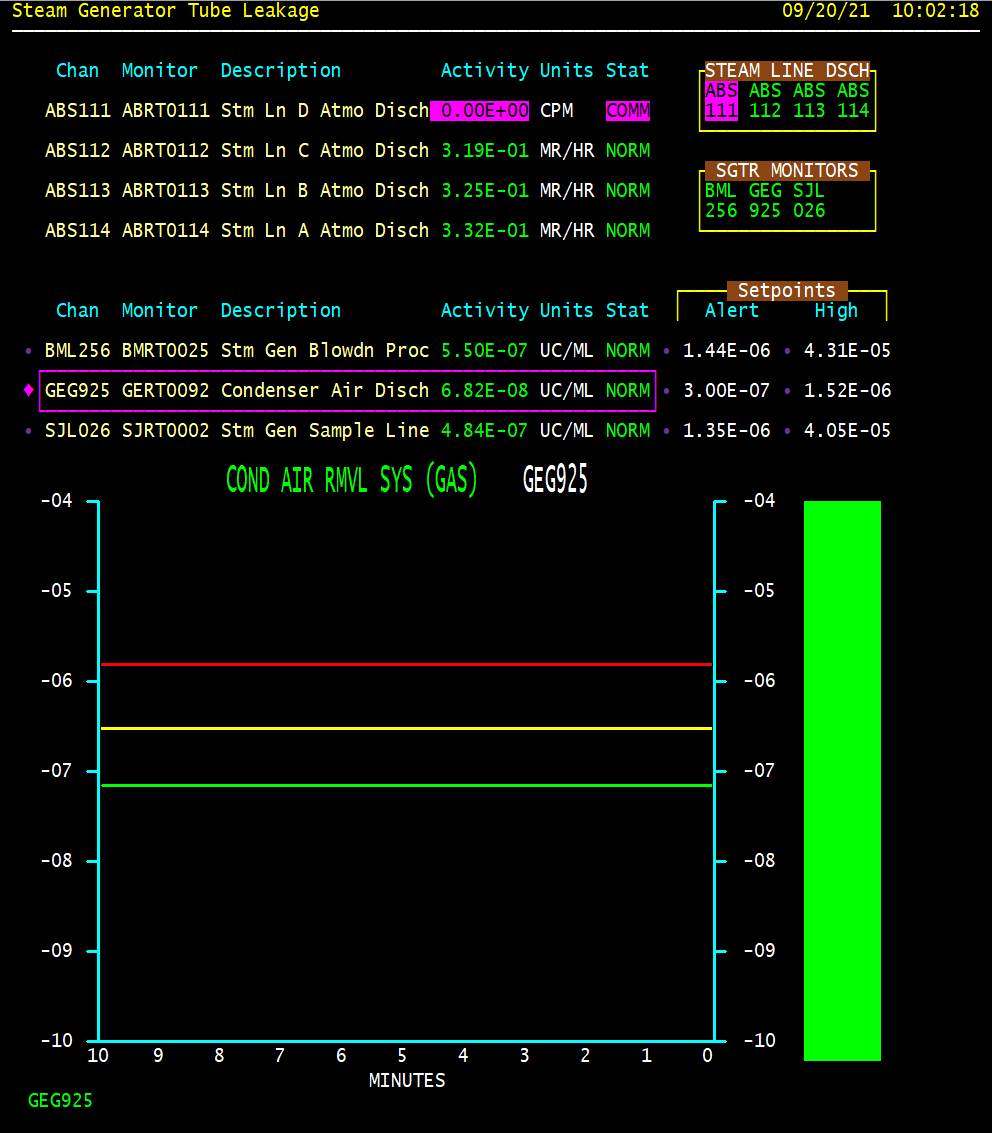
This Steam Generator Tube Leakage screen was designed by operators at one site to show
exactly what they need to see.
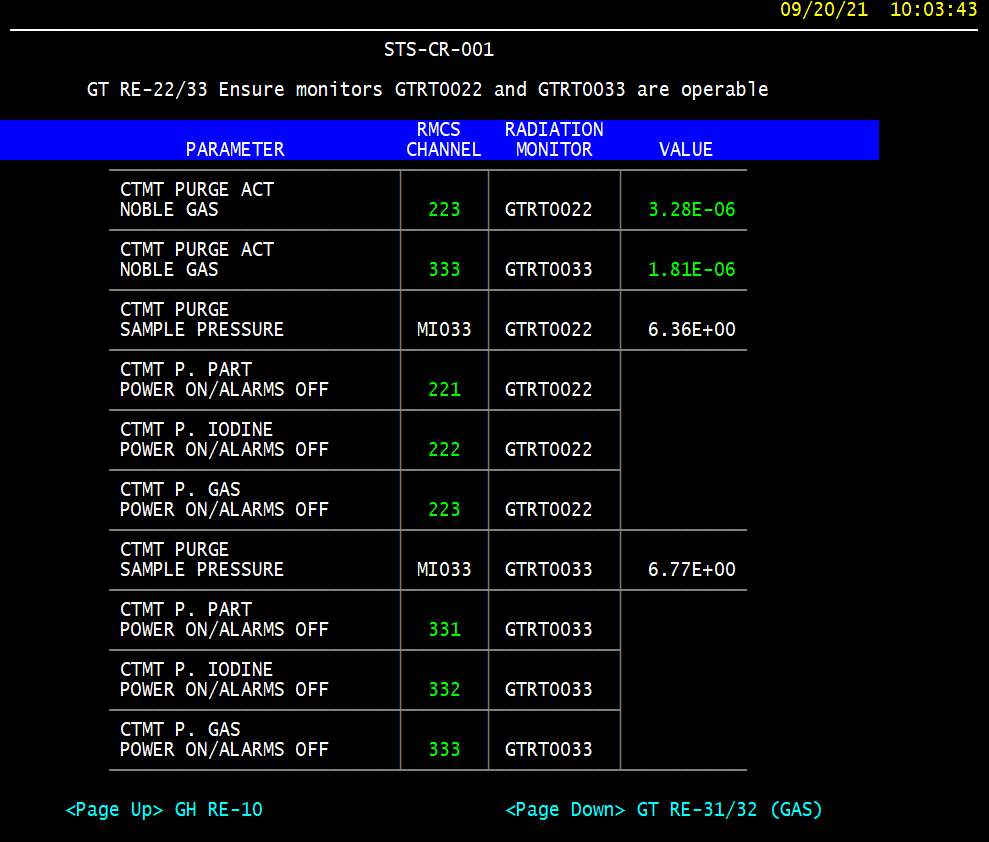
One customer designed an entire set of these screens. They look almost exactly like the forms filled
out as part of end-of-shift reports and help make those reports a little easier to fill out.
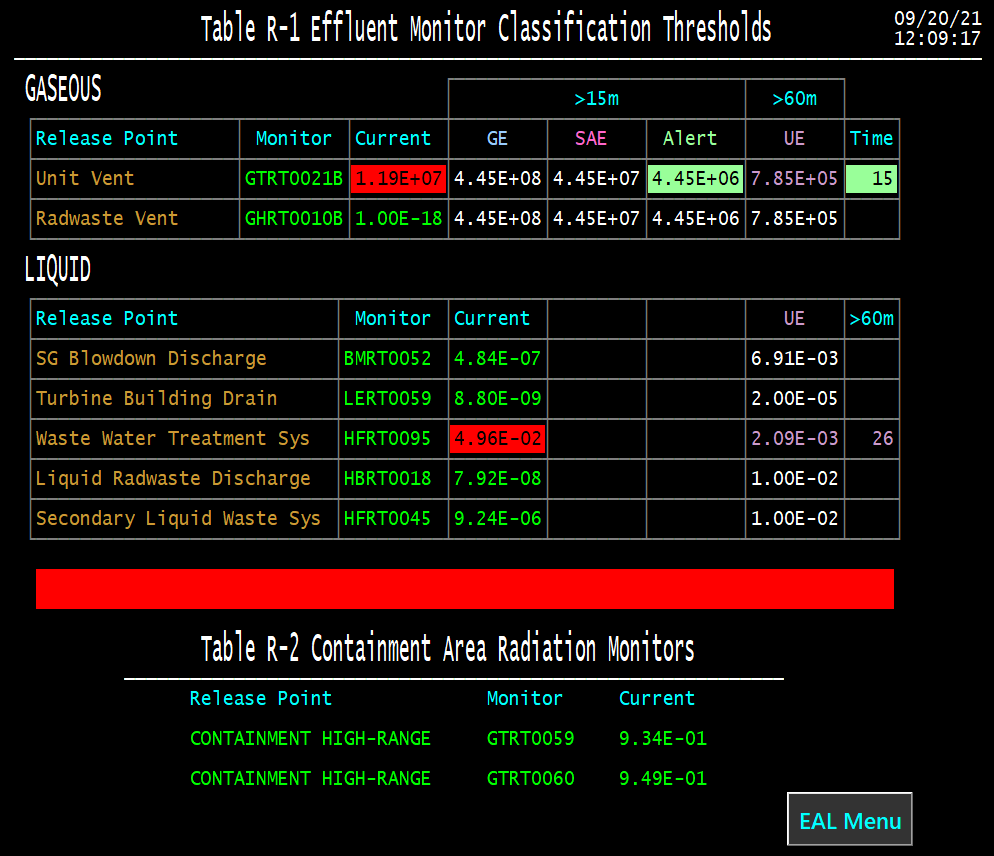
This Emergency Action Level screen was designed by a customer as well. This screen includes some
persistent calculations that are beyond the capability of the display program, so an additional task
was created to compute and provide the necessary values to the system at all times, whether or not
the screen is currently being viewed.
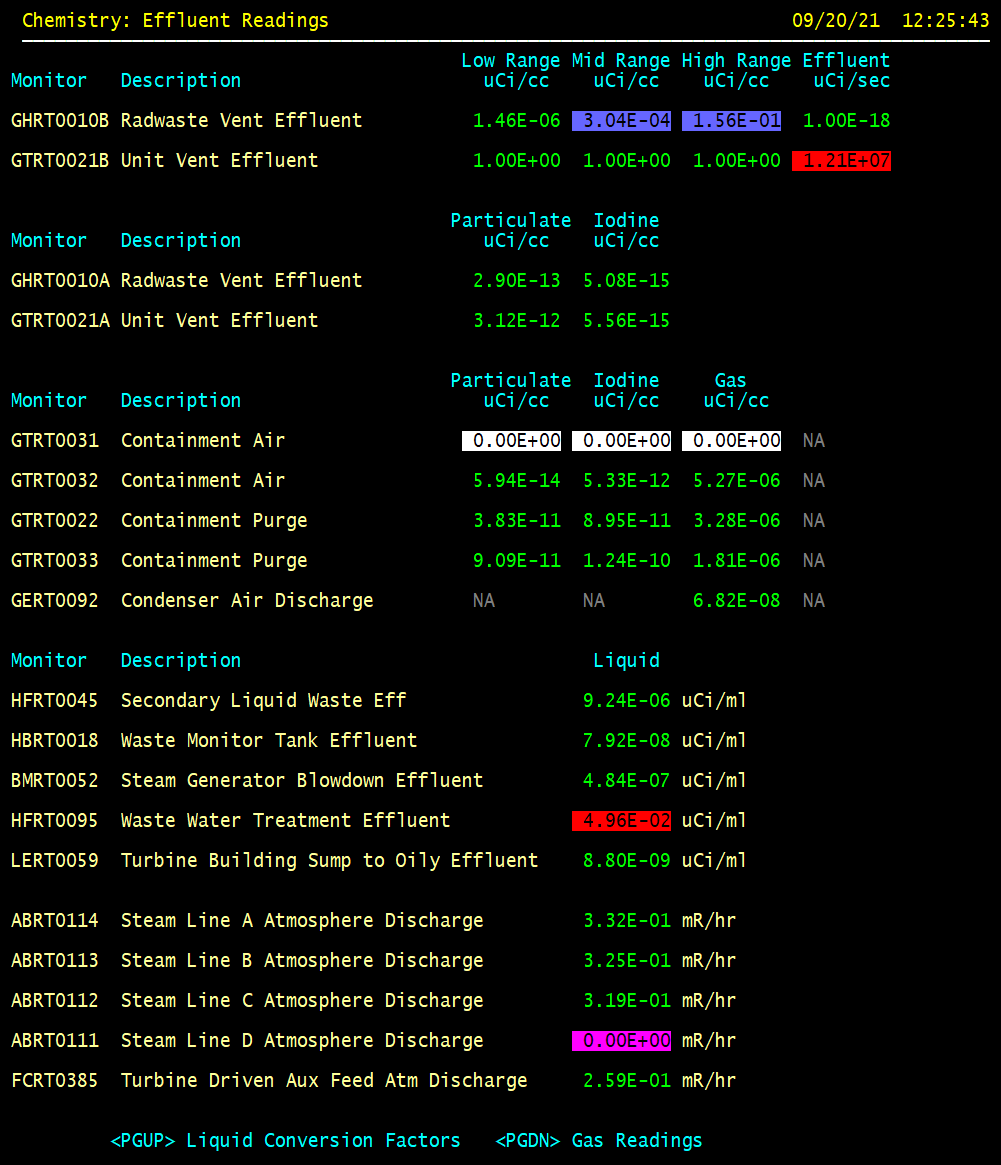
This screen is an example of a set created for use by Chemistry at one site. Some of the pages are
for surveys while others are designed to make it easier for Chemistry to update alarm setpoints and
conversion constants for the RM-80s, when necessary.
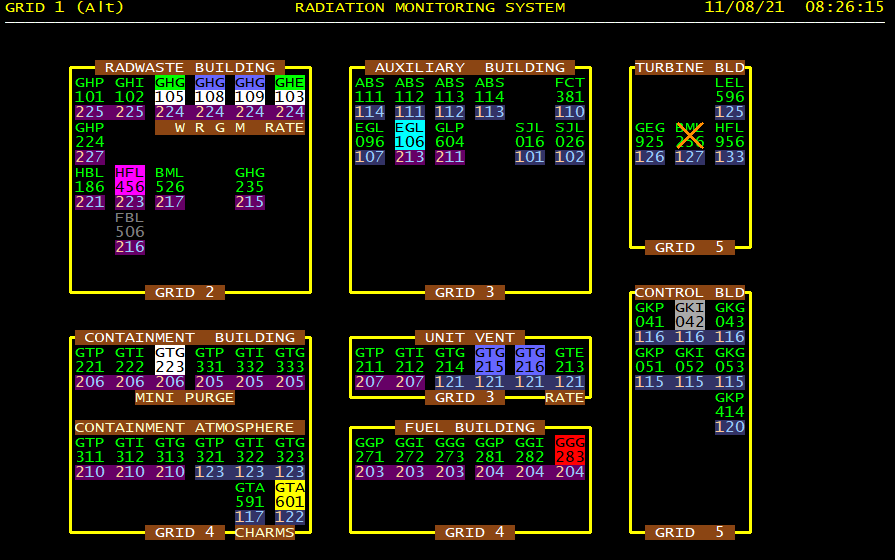
Sometimes, it is useful to be able to quickly visualize which RM-80s are on each loop. This alternate
form of GRID1 adds each channel's loop and RM-80 address below the channel tag. The background colors
are different for loops 1 & 2 to help quickly identify RM-80s on the same loop. When a group of
RM-80s show a communication failure at the same time, this will easily show whether or not the issue is
restricted to a single loop.
Miscellaneous Screens and Features
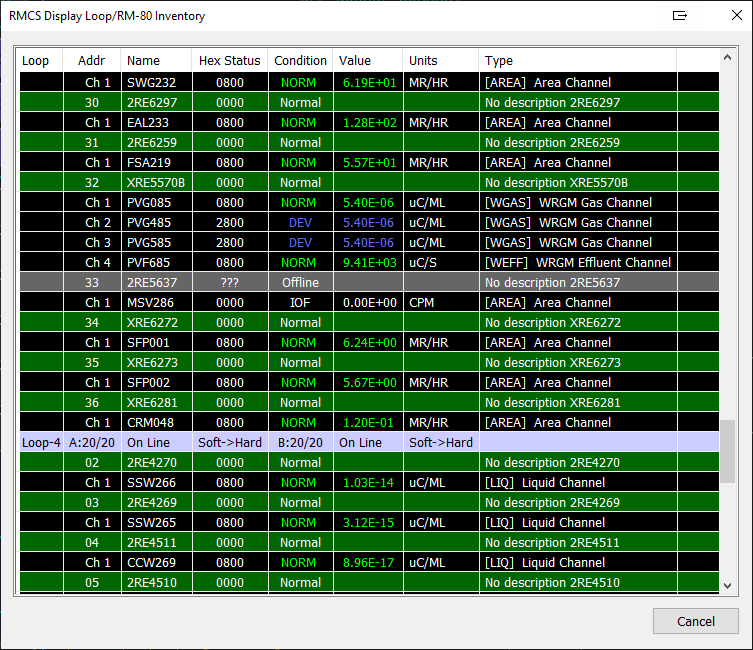
The display version of the System Inventory Report shows a list of all on the channels on all of
the RM-80s on all of the loops, sorted by address (Loop → RM-80 → Channel). Names,
descriptions, current values and conditions are all included in the list.
Administrator Screens and Features
Tools and functions restricted to Administrator level users only can alter the behavior
and appearance of RMCS Display.
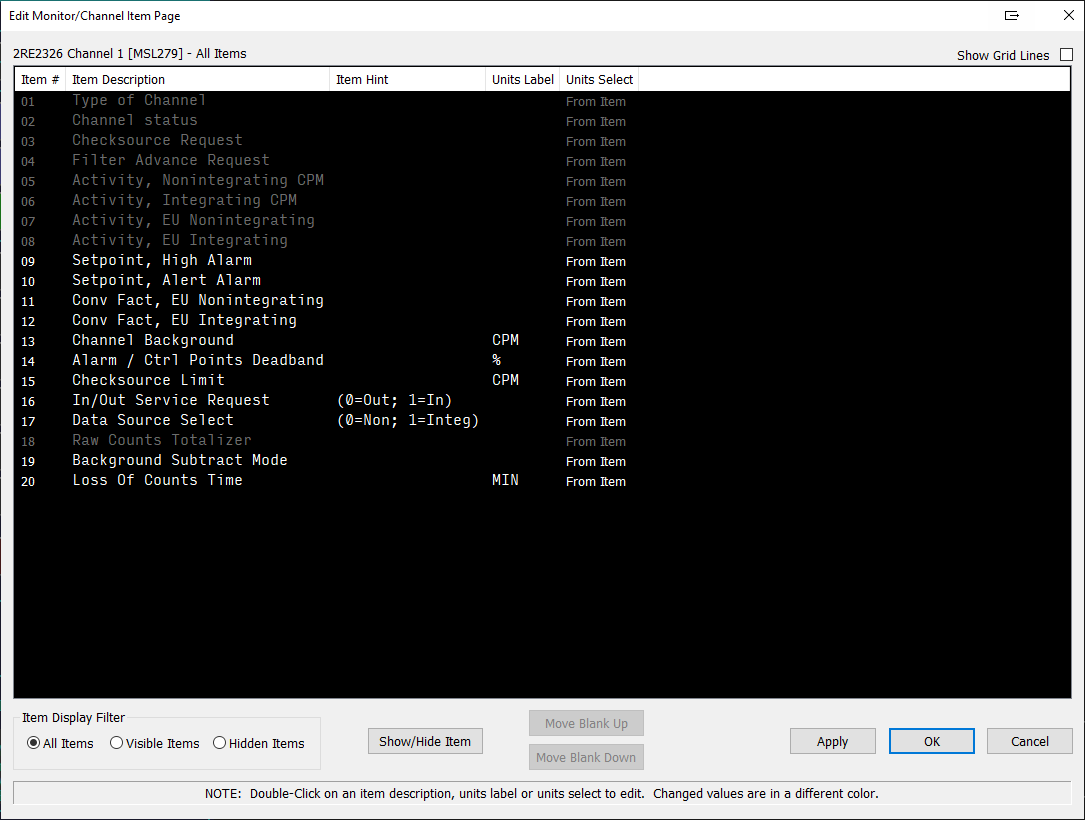
This tool allows administrators to control which items appear on the channel and monitor item edit
screens. The description, hint and units label may also be edited using this tool. These changes will
affect ALL RMCS nodes.
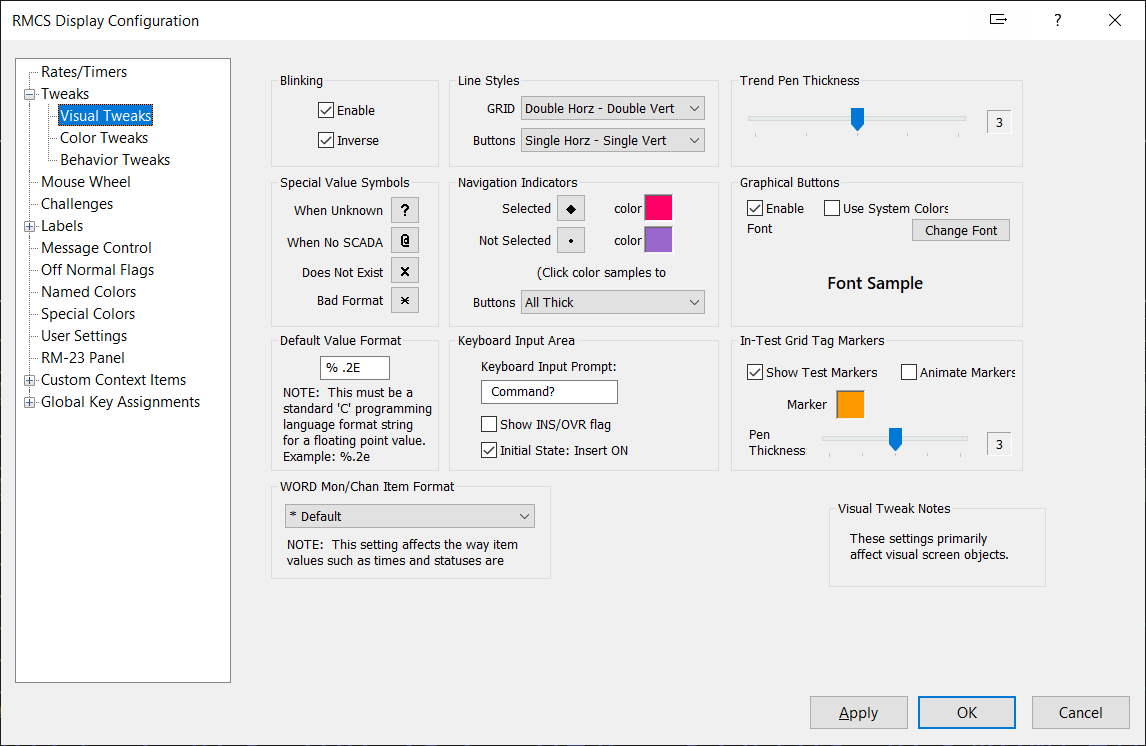
Here is an example of one of the RMCS Display configuration panels. Most items in the tree list at
the left of the dialog have a settings panel. The configuration changes affect only the LOCAL RMCS node.
Sample Report Output
These reports provide examples of what RMCS Display can create. It is also possible
to use the PICS Web Interface to use HTML to create web pages that include RMCS Data
that may be printed (or viewed) as reports.
When RMCS Display creates a print job, a random signature value is added to the job title so that
each job has a unique title. This is important when the job title is also used as a file name
(internally for temporary files and externally for things like the PDF output used to generate
these samples.)
NOTE: |
These example reports are linked as PDF files. Some browsers include a built-in PDF viewer while
others may offer to open the PDF in an external viewer (e.g. Adobe Acrobat). If your browser replaces
this tab with the PDF document, use the browser's BACK button to return to this screen. Otherwise,
look for the RMCS Screen shots tab to return to this page. |
- Off Normal Summary
- List of the current value and status of all channels that are currently "off normal"
- Off Scan Summary
- List of the last known value and status of all channels that are NOT currently
being scanned (polled) by RMCS.
- On Scan Summary
- List of the current value and status of all channels that are currently being scanned (polled) by RMCS.
- Relay Summary
- When the external relay control feature is included in the RMCS software key, this report lists
all of the monitors and/or channels that are contributing to each lit relay.
- RM-80 Database, Detailed
- This multi-page report has one page for the monitor and one for each channel. The page layout
is quite similar to forms that are typically used during initial RM-80 system installation.
- RM-80 Database, Condensed
- Two page report in a format similar to the RM-80 Database screen. One page for the CURRENT RMCS
Database item values and the other for the MASTER values.
- RMCS/RM80 DB Compare, One
- List of ONE RM-80's differences between the RMCS Database's MASTER and CURRENT values for every
monitor and channel item it has.
- RMCS/RM80 DB Compare, All
- List of ALL differences between the RMCS Database's MASTER and CURRENT values for every monitor
and channel item for the RM-80s.
- RMCS Inventory
- The RMCS Inventory report shows a list of all on the channels on all of the RM-80s on all of
the loops, sorted by address (Loop → RM-80 → Channel). Names, descriptions, current
values and conditions are all included in the list.
- Software/Layout Versions
- All of the layout files are scanned for a version tag, then a report is written showing all of
the currently running RMCS software versions and all of the layout file versions.
- Grid Report
- This special report lists current data for every channel listed on the current GRID screen. The
report is sequenced by moving across the screen from left to right, row by row from top to bottom
and as a channel is found, it is added to the report. This report may only be printed when a GRID
screen is being displayed.
- Calibration Report
- This report may be printed from the Calibration Control tool at any point during a calibration
procedure.
- Text Only Screen Print
- The text content and alarm areas of a screen may be printed in black & white text
mode. Note that this mode does not print any of the screen's graphic elements or colors.
- Graphic Screen Print
- This prints a graphic image of the full RMCS Display screen, exactly as it looks on the monitor.
All of the images used for screen shots were captured using this feature.
For more info contact,
Harry "Butch" Young: |
|
.png)
.png)
.png)
.png)
.png)
.png)
.png)
.png)